Data Cube Filters
Data cubes contain groups of data sets, some of which exist in multiple cubes. The data cube filters are common to all the data cubes.
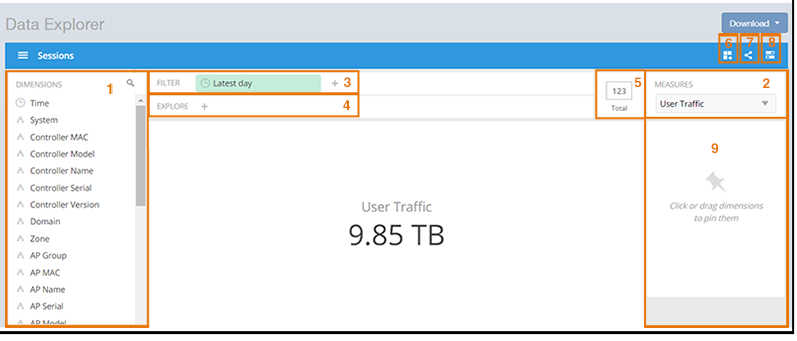
| No | Name |
|---|---|
| 1 | Dimensions |
| 2 | Measures |
| 3 | Filter |
| 4 | Explore |
| 5 | View Outputs |
| 6 | Add to Dashboard |
| 7 | Share Link |
| 8 | Options |
| 9 | Pinboard |
Dimensions Filter
The Dimensions filter list the industry standard details for radio such as Time, AP name, System, and Zone name. You can apply one or more dimensions to the following:
- Filter: On one or more dimensions. The default dimension is Time.
- Explore: On one or more dimensions. Every dimension used in Explore can be sorted by one or more selected measures, and the number of dimensions to be listed in the table can be selected (5, 10, 25, 50, 100, 500 or 1000). You can also change the sorting order of the dimensions to be explored and pivot or change the hierarchy.
- Pin: One or more dimensions can be attached to the Pinboard for easy reference.
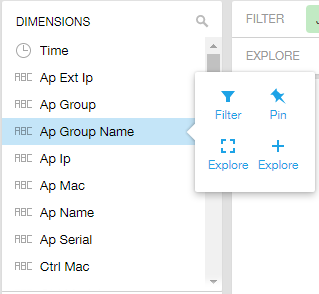
You can use the scroll bar for each data cube to view the supported dimensions for that cube. The following table describes all the dimensions that are supported on one or more data cubes in RUCKUS Analytics.
| Dimension Name | Description | Supported Data Cubes |
|---|---|---|
| Alarm Code | Unique string assigned by the controller to an alarm. | AP Alarms |
| Alarm State | Indicates if the alarm is outstanding. | AP Alarms |
| Alarm Type | Description for access point and controller alarms. | AP Alarms |
| Alarm UUID | Unique string assigned by the controller to an alarm. | AP Alarms |
| AP Description | Description string of the access point that is configured in the controller. |
|
| AP External IP | External IP address of the access point. |
|
| AP Group | AP Groups configured in the cloud. |
|
| AP Internal IP | Internal IP address of the access point. |
|
| AP Latitude | Latitude of GPS coordinates. | AP Inventory |
| AP Longitude | Longitude of GPS coordinates. | AP Inventory |
| AP Location | Location string of the access point that is configured in the AP on the cloud. |
|
| AP MAC | Base MAC address of the access point. |
|
| AP Model | Description of the access point model type. |
|
| AP Name | Name of the access point configured in the controller. |
|
| AP Serial | Serial number of the access point. |
|
| AP Version | Firmware version number of the access point. |
|
| Application Category | Amount of user traffic by category. | Applications |
| Application Name | Name of the application accessed by the Wi-Fi client. | Applications |
| Authentication Method | The Wi-Fi encryption and authentication method adopted. |
|
| BSSID | Basic service set identifier. | Network |
| Cable modem firmware | Firmware version of the cable modem. | AP Inventory |
| Cable modem IP | IP address of the cable modem. | AP Inventory |
| Cable modem MAC | MAC address of the cable modem. | AP Inventory |
| Category | Category for access point and controller alarms or events. |
|
| Channel | The Wi-Fi channel number used. |
|
| Client IP | Internal IP address of the Wi-Fi client. |
|
| Client MAC | MAC address of the Wi-Fi client. |
|
| Client Radio Mode | Possible values are: ac, n, a, g, b, or "unknown" (if SmartZone version is prior to 3.6). |
|
| Connection Status | Connection status of the access point: Online, Offline, Discovery, Provisioned. |
|
| Disconnect Time | Disconnect time of a session. | Sessions |
| Event Code | Code number for access point and controller events. | Events |
| Event Type | Description for access point and controller events. | Events |
| First Connection | First connection time of a session. | Sessions |
| Hostname | Hostname configured in the Wi-Fi client. |
|
| Last Status Change | Date and time of the last change in Connection Status of the access point. | AP Inventory |
| Manufacturer | Manufacturer information for the Wi-Fi client. |
|
| OS Type | Operating System information for the Wi-Fi client. |
|
| Port | Port of the application accessed by the Wi-Fi client. | Applications |
| Radio | Indicates the radio frequency band: 2.4GHz or 5GHz. |
|
| Reason | Additional description for access point and controller alarms or events, if available. |
|
| Roaming Session ID | A unique session ID that is created when a client roams to multiple APs within a short-enough time span that the client is connected to these APs simultaneously. |
|
| Rogue AP MAC | MAC Address of the detected Rogue AP. | Rogue APs |
| Rogue Channel | The Wi-Fi channel that the Rogue APs was operating on. | Rogue APs |
| Rogue Encryption | The Wi-Fi encryption and authentication method adopted by the rogue AP. | Rogue APs |
| Rogue Radio | The radio band (2.4GHz or 5GHz) that the rogue AP was operating on. | Rogue APs |
| Rogue SSID | SSID of the detected Rogue AP. | Rogue APs |
| Rogue Type | Possible types are: ignore, known, rogue, and malicious | Rogue AP |
| Session ID | ID string assigned to a session. |
|
| Session Type | Indicates whether the session is authorized or unauthorized. |
|
| Severity | Severity level for access point and controller alarms or events. |
|
| SSID | Service set identifier (SSID) configured in the cloud. |
|
| Time | Allows the data to be viewed in terms of data points with timestamps. Time granularity of 1 minute, 15 minutes, 1 hour, 1 day, and 1 week can be chosen. |
|
| Username | Username of the user account associated with the Wi-Fi client. |
|
Measures Filter
You can select one or more measures by which you want to sort the selected dimension. Based on the selected cube, measures can vary.
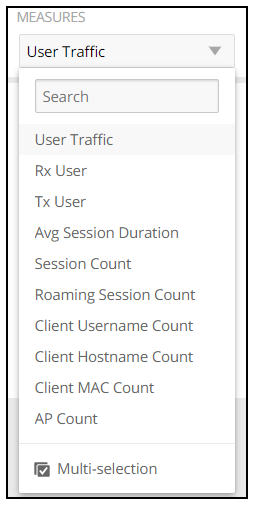
You can use the lists for each data cube to view the supported measures for that cube. The following table describes all the measures that are supported on one or more data cubes in RUCKUS Analytics.
| Measure Name | Description | Supported Data Cubes |
|---|---|---|
| AP Count | Unique number of access points. |
|
| AP Uptime | Uptime percentage for an access point. | AP Inventory |
| AP-to-Cloud Ping Latency | Average time, in milliseconds, for the AP to transmit a packet to the cloud, and receive the packet back. | Network |
| Avg Airtime Busy | Average of the airtime busy metric. | Airtime Utilization |
| Avg Airtime Idle | Average of the airtime idle metric. | Airtime Utilization |
| Avg Airtime Rx | Average of the airtime receive metric. | Airtime Utilization |
| Avg Airtime Tx | Average of the airtime transmit metric. | Airtime Utilization |
| Avg Airtime Utilization | Average of the total airtime utilization. | Airtime Utilization |
| Avg Noise Floor | Average noise floor power in dBm. | Clients |
| Avg RSS | Average received signal strength of the access point in dBm. | Clients |
| Avg Session Duration | Average time duration for a session. | Sessions |
| Avg SNR | Average signal to noise ratio at the access point in dB. | Clients |
| Avg Throughput Estimate | Average throughput estimate for the Wi-Fi client. | Clients |
| Client Hostname | Name of the client |
|
| Client MAC Count | Unique number of Wi-Fi clients. |
|
| Client Username | Name of the user |
|
| Count | Client count |
|
| Failed Associations | Number of failed associations. | Network |
| Failed Authentications | Number of failed open authentications | Network |
| Mgmt Traffic | Traffic volume, which is transmitted and received in IEEE 802.11 control and management frames; this includes all unicast, multicast, and broadcast traffic. |
|
| Max Offline Duration | The maximum offline duration within the selected time range. | AP Inventory |
| Max Rogue SNR | The maximum detected signal to noise of the rogue AP. | Rogue APs |
| Max RSS | Maximum received signal strength of the access point in dBm. | Clients |
| Max SNR | Maximum signal to noise ratio at the access point in dB. | Clients |
| Min RSS | Minimum received signal strength of the access point in dBm. | Clients |
| Min SNR | Minimum signal to noise ratio at the access point in dB. | Clients |
| Reboot Count | Events | |
| Roaming Session Count | The number of roaming sessions for a specific client. A roaming session occurs when a client roams quickly enough to remain connected to multiple APs simultaneously. If you find a client that has a large number of roaming sessions, you can use various dimensions in Data Explorer to obtain details about the APs. |
|
| Rogue AP Count | The number of rogue APs detected by all the APs in your network. | Rogue APs |
| Rx Failures | Receive packets which failed to be processed due to insufficient buffer in AP. | Network |
| Rx Management | Traffic volume, which is received by AP (Access Point) in IEEE 802.11 control and management frames; this includes all unicast, multicast, and broadcast traffic. |
|
| Rx Total | Sum of the received user and management traffic. |
|
| Rx User | Traffic volume, which is received by AP in IEEE 802.11 MAC Service Data Unit (MSDU) data frames; this includes all unicast, multicast, and broadcast traffic. |
|
| Session Count | Number of unique sessions. |
|
| Successful Associations | Number of successful associations. | Network |
| Successful Authentications | Number of successful open authentications | Network |
| Successful Authentication Ratio | Ratio of number of successful open authentications over total number of open authentications. | Network |
| Total Data Frames Ratio | Percentage of all transmit and receive packets that are data. | Network |
| Total Management Frames Ratio | Percentage of all transmit and receive packets that are management. | Network |
| Total Traffic | Sum of the user and management traffic. |
|
| TxBroadcastFrames | Number of broadcast packets transmitted by the network. | Network |
| TxDropDataFrames | Transmit data frames that are dropped by the message queue. | Network |
| Tx Failures | Transmit packets which failed to be processed due to insufficient buffer in AP. | Network |
| Tx Management | Traffic volume, which is transmitted by AP (Access Point) in IEEE 802.11 control and management frames; this includes all unicast, multicast, and broadcast traffic. |
|
| TxMulticastFrames | Number of multicast packets transmitted by the network. | Network |
| Tx Total | Sum of the transmit user and management traffic. |
|
| TxUnicastFrames | The number of data packets transmitted by the network that are not broadcast or multicast packets. | Network |
| Tx User | Traffic volume, which is transmitted by AP (Access Point) in IEEE 802.11 MAC Service Data Unit (MSDU) data frames; this includes all unicast, multicast, and broadcast traffic. |
|
| User Traffic | Traffic volume, which is transmitted and received in IEEE 802.11 MAC Service Data Unit (MSDU) data frames; this includes all unicast, multicast, and broadcast traffic. User Traffic = Rx User + Tx User |
|
Filter
You can use Filter to segregate the data by dimensions such as Time Range, and other dimensions. You can filter on one or more dimensions, and change the sorting hierarchy as required. You can also define the dimensions based on specific properties of the dimension, for example, Time has relative and specific settings. The default dimension is Time, because the databases are very large and can crash the system without this filter.

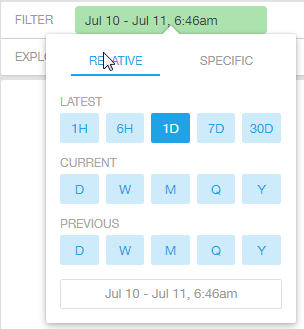
You can specify the following relative time settings:
- Latest time of 1 hour, 6 hours, 1 day, 7 days, or 30 days
- Current time of day, week, month, quarter, or year
- Previous time of day, week, month, quarter, or year
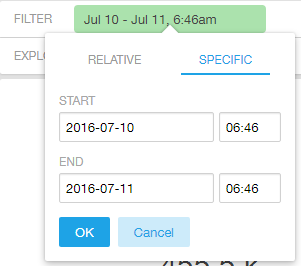
You can specify the start and end dates and times for the specific time settings.
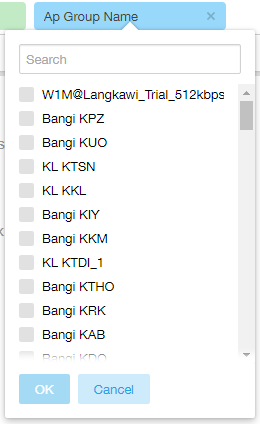
You can search the list of the dimensions and select specific entries. By default, all the data that matches the dimension is listed.
Explore Filter
The Explore filter enables visualization based on dimensions and time (data granularity).

You can explore one or more dimensions using a methodology similar to pivot tables, and change the sorting hierarchy as required. You can define the number of rows to be listed the screen.
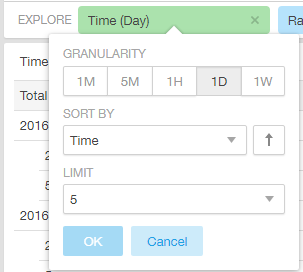
You can use the following time filters:
- Set the data granularity to 1 minute, 5 minutes, 1 hour, 1 day, or 1 week.
- Sort by any of the measures related to the dimension.
- Limit the number of rows displayed for the dimension to 5, 10, 25, 50, 100, 500, or 1000.
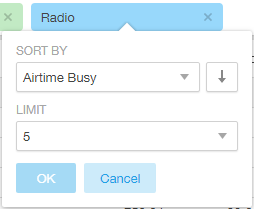
You can use the following measures filters:
- Sort by any of the measures related to the dimension.
- Limit the number of rows displayed for the dimension to 5, 10, 25, 50, 100, 500, or 1000.
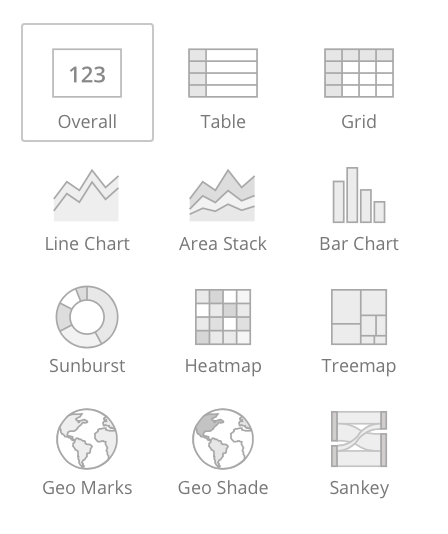
View Outputs Filter
- Total
- Table
- Grid
- Line Chart
- Bar Chart
- Heatmap
- Sunburst
- Geo
The default view is Total.
Add to Dashboard Icon
The Add to Dashboard icon allows you to add a tile you are currently developing to an existing dashboard or to a dashboard that you want to create.

Share Link Icon
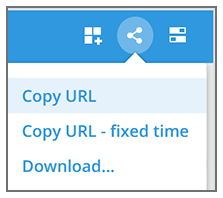
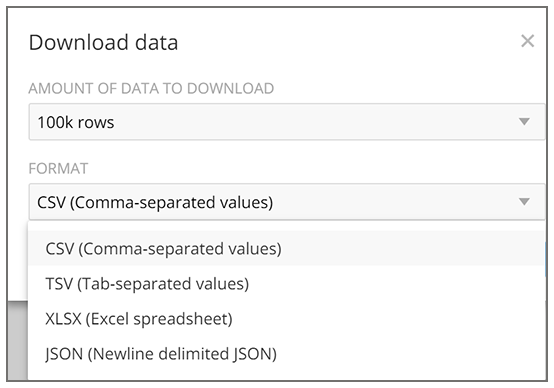
You can share the URL, export to various formats, view raw data, or download the information. The following figure shows the various formats you can choose for downloading data. You can also select the number of rows to download.
Options Icon
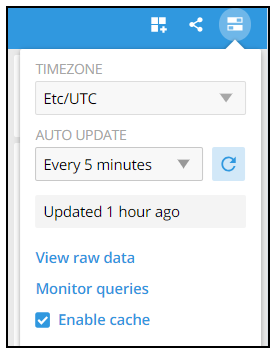
The Options icon allows you to set the time zone, auto update time for the dashboard data, view raw data, monitor queries, and enable cache memory as shown.
Pinboard Pane
You can click or drag dimensions and pin them on the pinboard. Retain the dimensions for ready reference during visualization.

Comparisons
Comparisons allow you to compare the current data of specified dimensions and measures to the same dimensions and measures during previous time periods. For example, the AP MAC dimension and User Traffic measure can be compared over time, as shown in the following figure. The Change column indicates how much user traffic has gone up or down for the corresponding AP over the specified period of time.
Creating a Data Comparison
You can create a data comparison using Data Explorer.
- From Data Explorer, select one of the data cubes.
- Drag one or more dimensions into the center pane, for example, AP MAC.
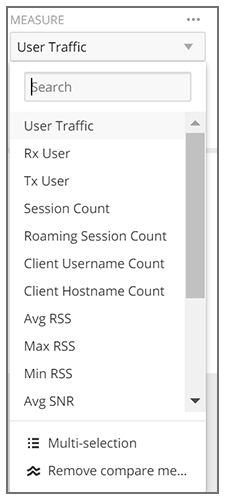
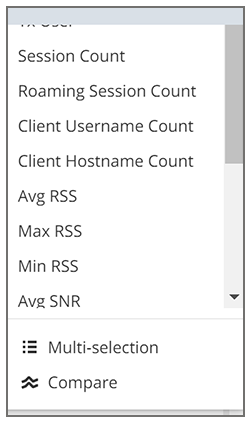
- From the Measure list, select one or more measures (use Multi-Selection for more than one).
- From the
Measure list, select
Compare.
Figure 295 Selecting Compare from the Measure List
- If you have already invoked
Compare, the previous time period you selected is automatically used, and a display such as the one in
Figure 294 is displayed. However, if you have not yet used Compare, or if you want to change the current time-period, invoke the
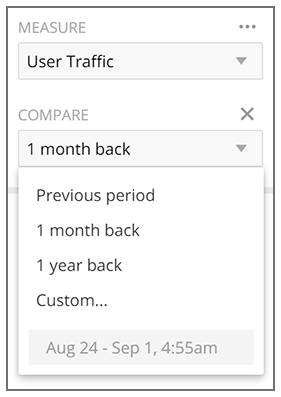
Compare list:
Figure 296 Using the Compare List
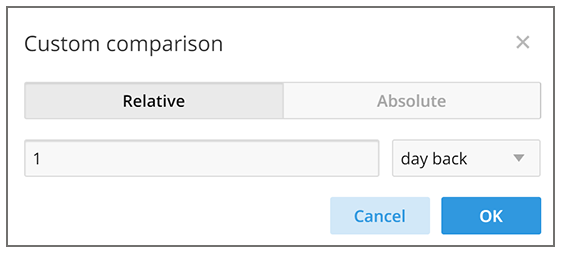
- (Optional) To customize your choice, click
Custom.
Custom comparison dialog box is displayed.
Figure 297 Custom Comparison Dialog Box
- To set a relative comparison, click the
Relative tab and select a measure from the relative measure list.
Figure 298 List of Choices from the Relative Measure List
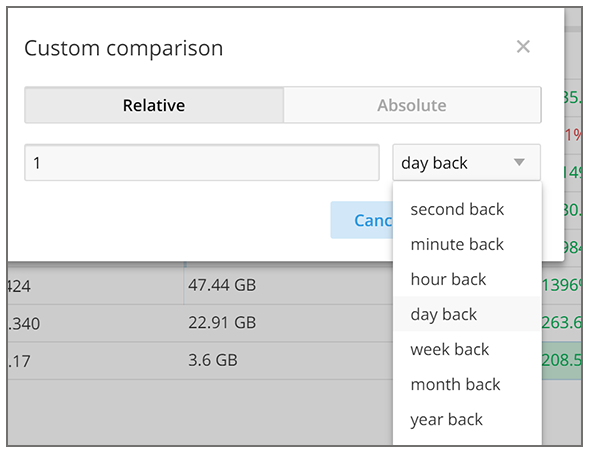
You can change the number of the measure to correspond to your selection in the relative measure list. Click OK to create the relative comparison.
- To create a custom time period, click the
Absolute tab.
Figure 299 Custom Comparison: Absolute Tab
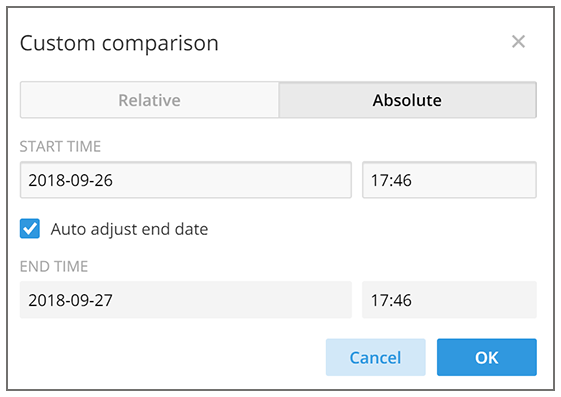
You can change the times as desired, and to have the end date automatically adjusted. Click OK to set the custom time period.
- To set a relative comparison, click the
Relative tab and select a measure from the relative measure list.
Removing the Compare Feature
If you want to remove the Compare measure from the data display, go to the Measure list, and select Remove Compare Measure.
