Data Cube Filters
Data cubes contain groups of data sets, some of which exist in multiple cubes. The data cube filters are common to all the data cubes.
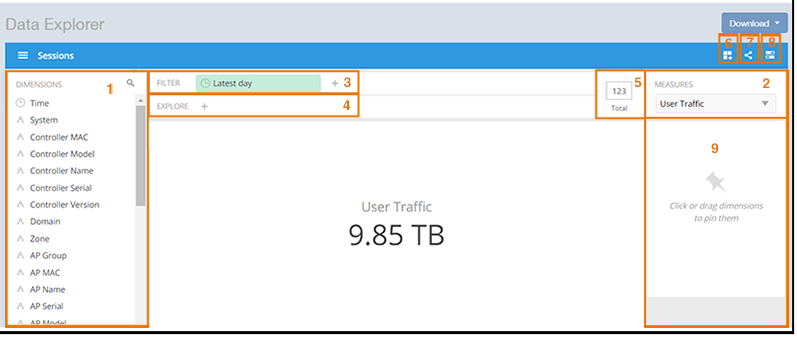
| No | Name |
|---|---|
| 1 | Dimensions |
| 2 | Measures |
| 3 | Filter |
| 4 | Explore |
| 5 | View Outputs |
| 6 | Add to Dashboard |
| 7 | Share Link |
| 8 | Options |
| 9 | Pinboard |
Dimensions Filter
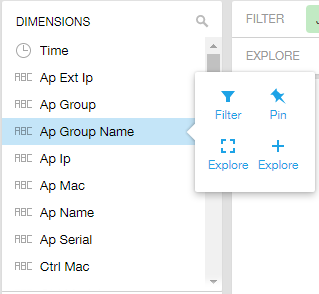
The Dimensions filter list the industry standard details for radio such as Time, AP name, System, and Zone name. You can apply one or more dimensions to the following:
- Filter: On one or more dimensions. The default dimension is Time.
- Explore: On one or more dimensions. Every dimension used in Explore can be sorted by one or more selected measures, and the number of dimensions to be listed in the table can be selected (5, 10, 25, 50, 100, 500 or 1000). You can also change the sorting order of the dimensions to be explored and pivot or change the hierarchy.
- Pin: One or more dimensions can be attached to the Pinboard for easy reference.
You can use the scroll bar for each data cube to view the supported dimensions for that cube. The following table describes all the dimensions that are supported on one or more data cubes in RUCKUS Analytics.
Measures Filter
You can select one or more measures by which you want to sort the selected dimension. Based on the selected cube, measures can vary.
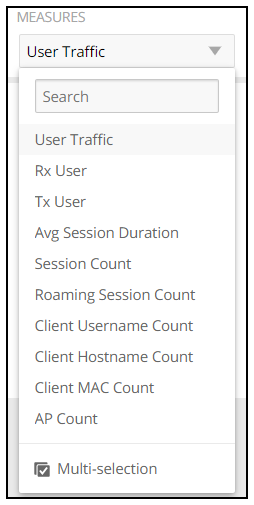
You can use the lists for each data cube to view the supported measures for that cube. The following table describes all the measures that are supported on one or more data cubes in RUCKUS Analytics.
Filter
You can use Filter to segregate the data by dimensions such as Time Range, and other dimensions. You can filter on one or more dimensions, and change the sorting hierarchy as required. You can also define the dimensions based on specific properties of the dimension, for example, Time has relative and specific settings. The default dimension is Time, because the databases are very large and can crash the system without this filter.

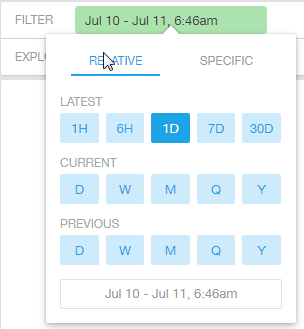
You can specify the following relative time settings:
- Latest time of 1 hour, 6 hours, 1 day, 7 days, or 30 days
- Current time of day, week, month, quarter, or year
- Previous time of day, week, month, quarter, or year

You can specify the start and end dates and times for the specific time settings.
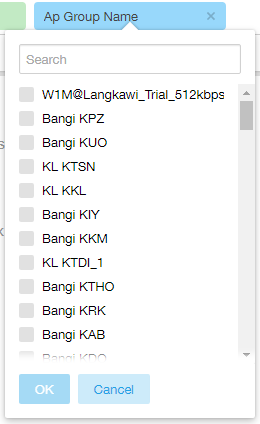
You can search the list of the dimensions and select specific entries. By default, all the data that matches the dimension is listed.
Explore Filter
The Explore filter enables visualization based on dimensions and time (data granularity).

You can explore one or more dimensions using a methodology similar to pivot tables, and change the sorting hierarchy as required. You can define the number of rows to be listed the screen.
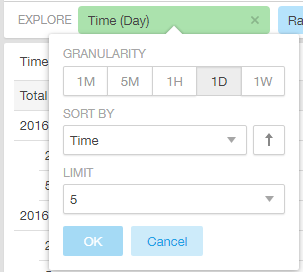
You can use the following time filters:
- Set the data granularity to 1 minute, 5 minutes, 1 hour, 1 day, or 1 week.
- Sort by any of the measures related to the dimension.
- Limit the number of rows displayed for the dimension to 5, 10, 25, 50, 100, 500, or 1000.
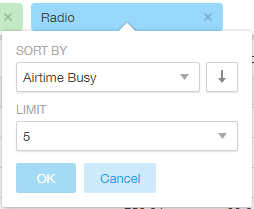
You can use the following measures filters:
- Sort by any of the measures related to the dimension.
- Limit the number of rows displayed for the dimension to 5, 10, 25, 50, 100, 500, or 1000.
View Outputs Filter
- Total
- Table
- Grid
- Line Chart
- Bar Chart
- Heatmap
- Sunburst
- Geo
The default view is Total.
Add to Dashboard Icon
The Add to Dashboard icon allows you to add a tile you are currently developing to an existing dashboard or to a dashboard that you want to create.

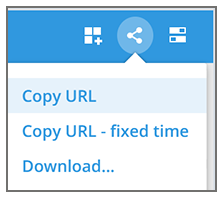
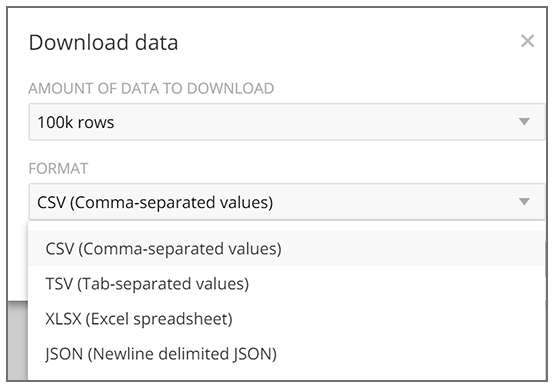
Share Link Icon
You can share the URL, export to various formats, view raw data, or download the information. The following figure shows the various formats you can choose for downloading data. You can also select the number of rows to download.
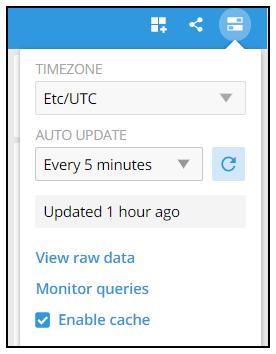
Options Icon
The Options icon allows you to set the time zone, auto update time for the dashboard data, view raw data, monitor queries, and enable cache memory as shown.
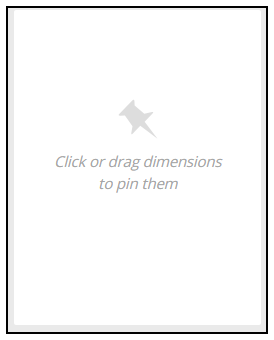
Pinboard Pane
You can click or drag dimensions and pin them on the pinboard. Retain the dimensions for ready reference during visualization.
Comparisons
Creating a Data Comparison
You can create a data comparison using Data Explorer.
- From Data Explorer, select one of the data cubes.
- From the Measure list, select one or more measures (use Multi-Selection for more than one).
- From the
Measure list, select
Compare.
Selecting Compare from the Measure List 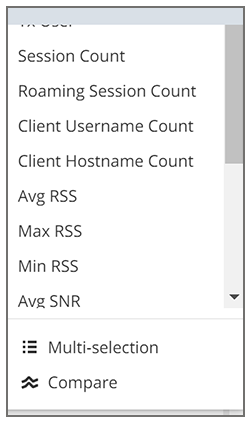
- If you have already invoked
Compare, the previous time period you selected is automatically used, and a display such as the one in
Time Compares is displayed. However, if you have not yet used Compare, or if you want to change the current time-period, invoke the
Compare list:
Using the Compare List 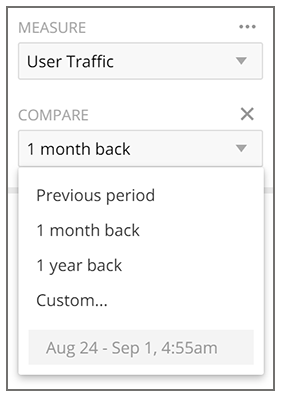
- (Optional) To customize your choice, click
Custom.
Custom comparison dialog box is displayed.
Custom Comparison Dialog Box 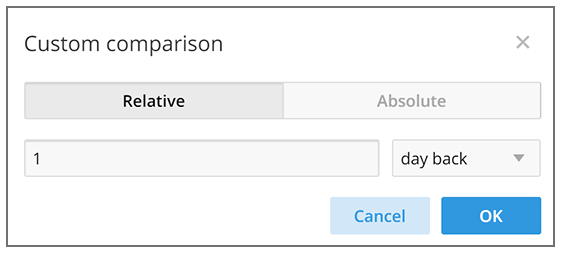
- To set a relative comparison, click the
Relative tab and select a measure from the relative measure list.
List of Choices from the Relative Measure List 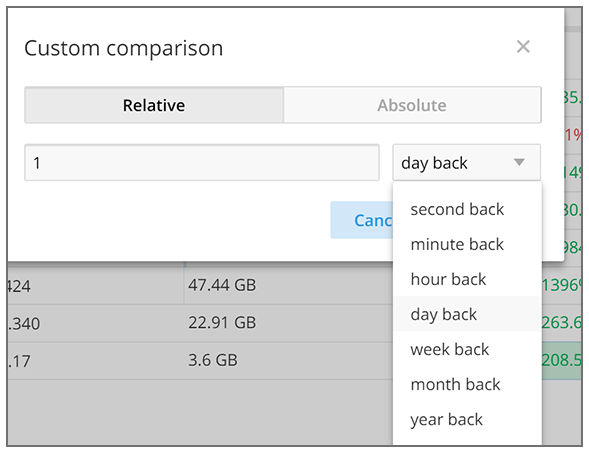
You can change the number of the measure to correspond to your selection in the relative measure list. Click OK to create the relative comparison.
- To create a custom time period, click the
Absolute tab.
Custom Comparison: Absolute Tab 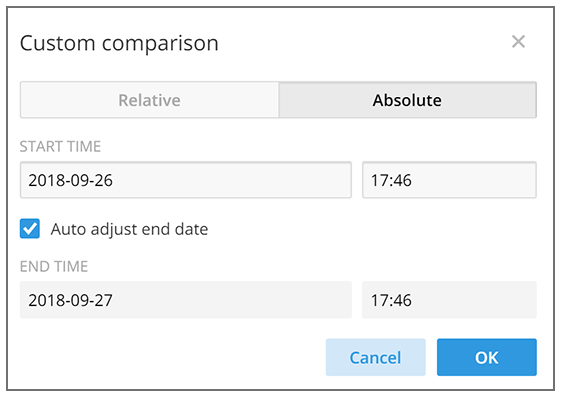
You can change the times as desired, and to have the end date automatically adjusted. Click OK to set the custom time period.
- To set a relative comparison, click the
Relative tab and select a measure from the relative measure list.
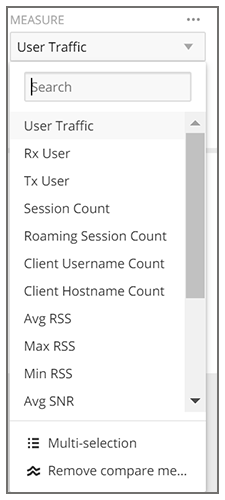
Removing the Compare Feature
If you want to remove the Compare measure from the data display, go to the Measure list, and select Remove Compare Measure.