Data Explorer and Data Cubes
Data Explorer and its individual cubes allow you to view, filter, and manipulate data in many different ways .
Data Exploration
Data exploration is the act of examining the minute details of an Online Analytical Processing (OLAP) cube.
Consider your data to be a three-dimensional cube that you would like to explore, both inside out and outside in, so that you can glean more insights from your data. Of course, most real world data sets will have more than three dimensions, but the concepts from a 3D cube can be directly extended to a multidimensional hypercube.
- Slice: Think of slicing a piece of cheese; you make a single cut to the cheese to expose the insides. A typical slice operation is the time slice. Instead of reviewing all the data of the last 30 days, you slice the data to expose only Day 1.
- Dice: Consider dicing a block of cheese; you make multiple cuts and separate the block into a number of smaller pieces. A typical dice operation involves taking a slice of data, such as the Day 1 data, and cutting it further to filter by the controller name and AP group. A smaller piece of the original OLAP cube results from the slice and dice operations.
- Dice: Consider dicing a block of cheese; you make multiple cuts and separate the block into a number of smaller pieces. A typical dice operation involves taking a slice of data, such as the Day 1 data, and cutting it further to filter by the venue name and AP group. A smaller piece of the original OLAP cube results from the slice and dice operations.
- Drill Up and Drill Down: In order to delve into the details, you can drill down to a specific AP in an AP group, and drill down further to a specific client host name. Conversely, you could search for a client MAC address and drill up to find the AP and controller to which it belongs.
- Drill Up and Drill Down: In order to delve into the details, you can drill down to a specific AP in an AP group, and drill down further to a specific client host name. Conversely, you could search for a client MAC address and drill up to find the AP and venue to which it belongs.
- Roll Up: The roll up operation typically involves numbers known as measures. After the slice, dice, and drill down of your data, you can roll up the numbers to gain a better understanding of the whole, for example, the total transmit traffic for the selected APs.
- Pivot: The pivot operation allows you to view the data from a different perspective. For example, you have a table showing a list of controllers and the APs belonging to each controller. You may pivot the table to show a list of the APs and the controllers to which they belong. Think of pivoting as changing the hierarchy between the dimensions.
- Pivot: The pivot operation allows you to view the data from a different perspective. Think of pivoting as changing the hierarchy between the dimensions.
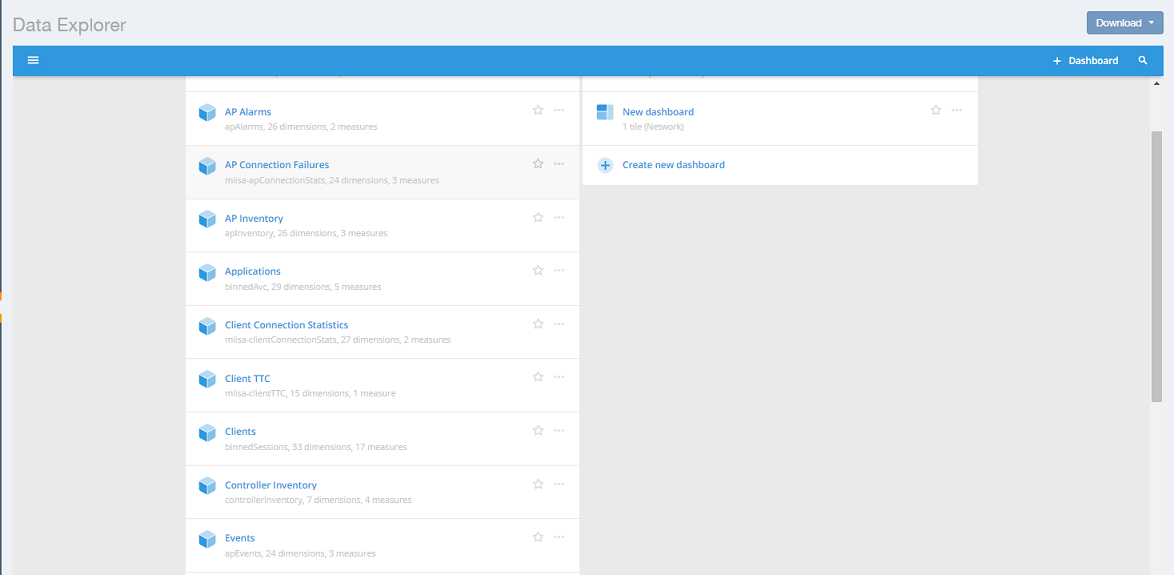
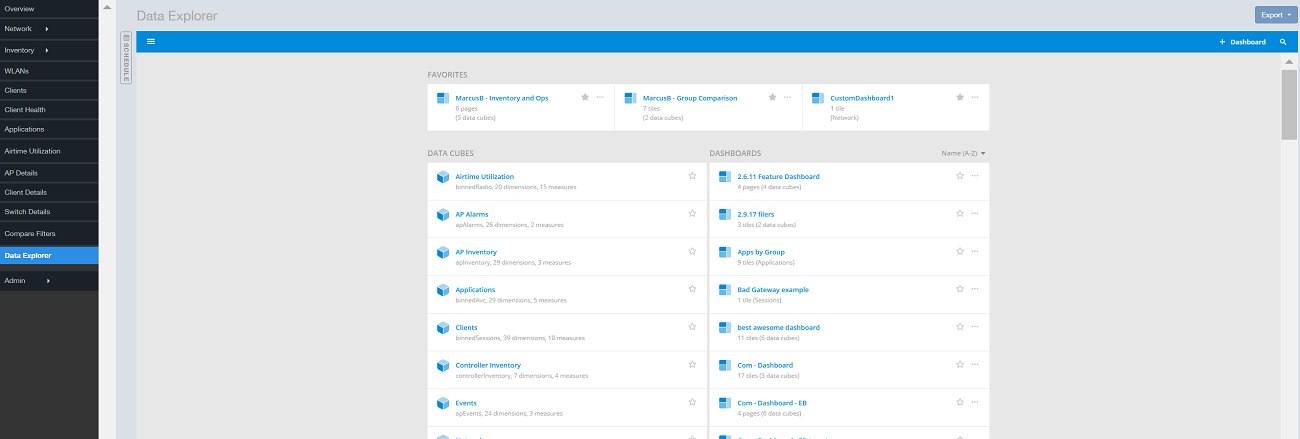
Data Explorer allows you to explore the data under various categories, using your own permutations and combinations, unlike the other canned reports available.
Applications
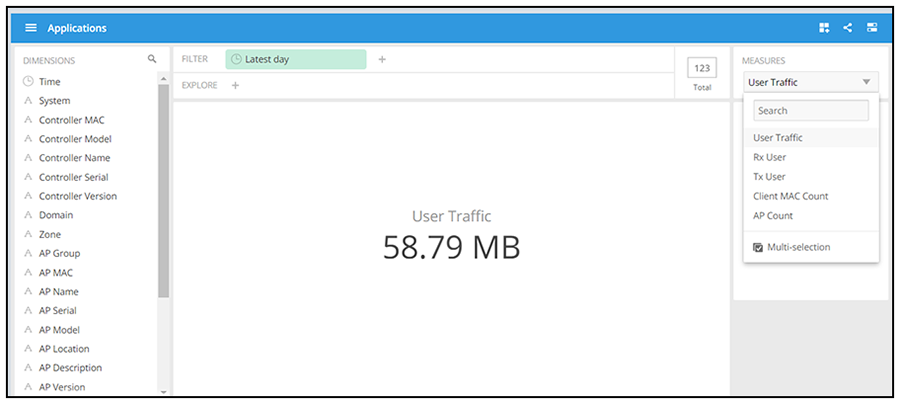
The Applications cube allows you to explore the application data your system uses.
Network
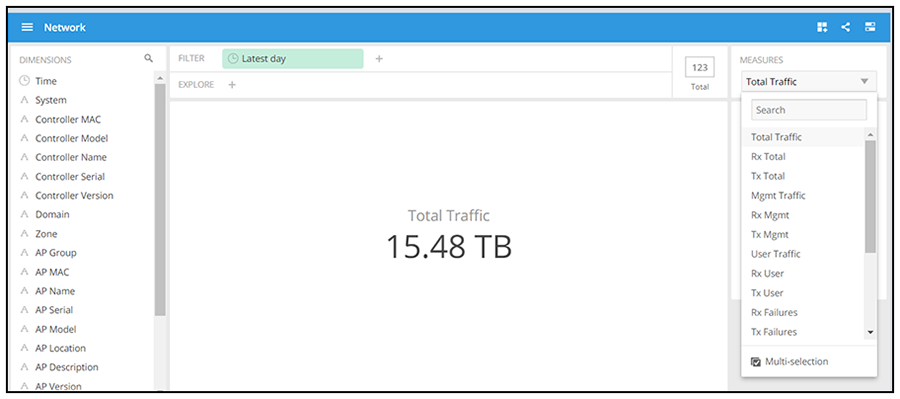
The Network cube allows you to explore network traffic data and its usage.
Airtime Utilization
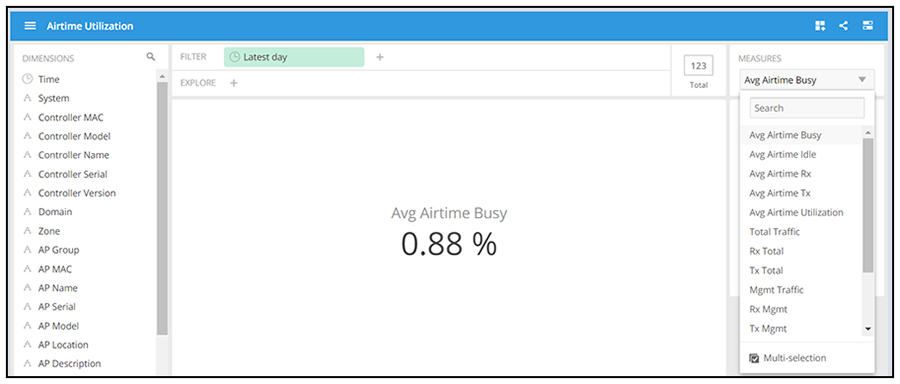
The Airtime Utilization cube allows you to explore the airtime utilization data in your system.
Clients
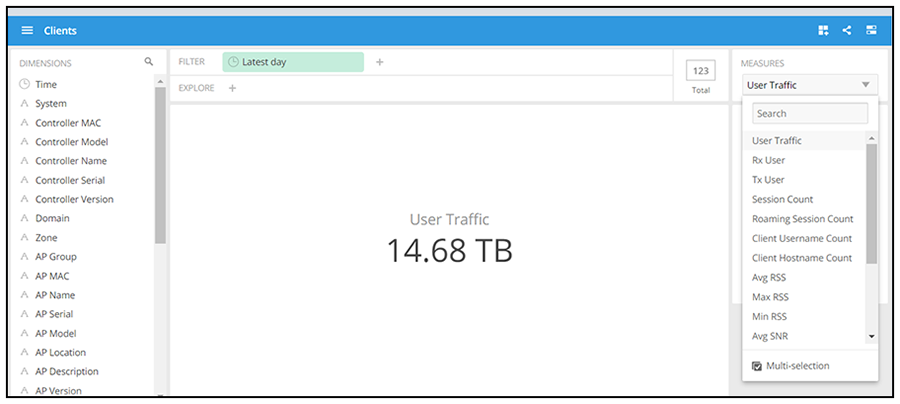
The Clients cube allows you to explore client data for your system.
Sessions
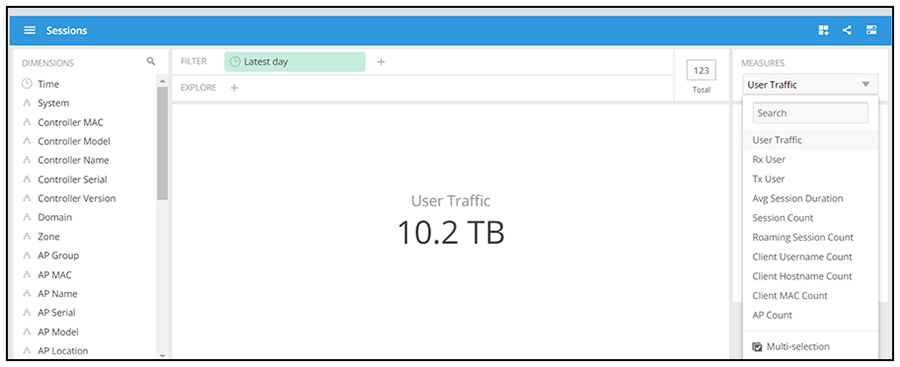
The Sessions cube allows you to explore data about the various sessions in your system.
Switch Inventory
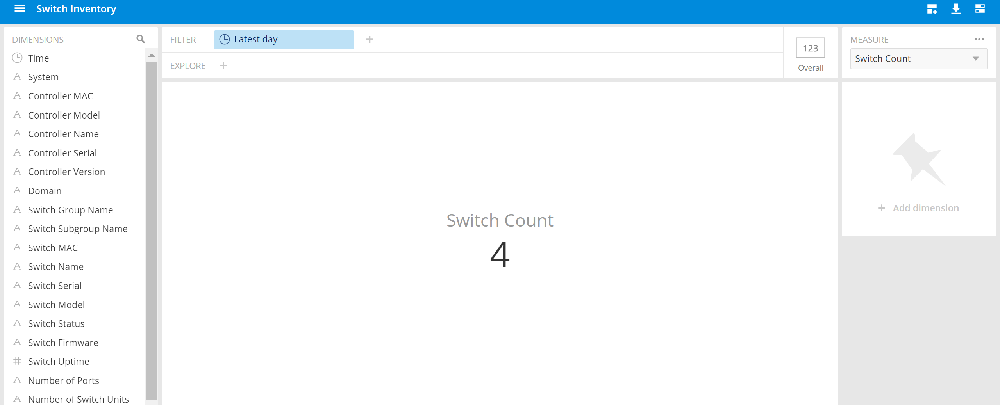
The Switch Inventory cube allows you to view information about the switch configuration data your system uses.
Events
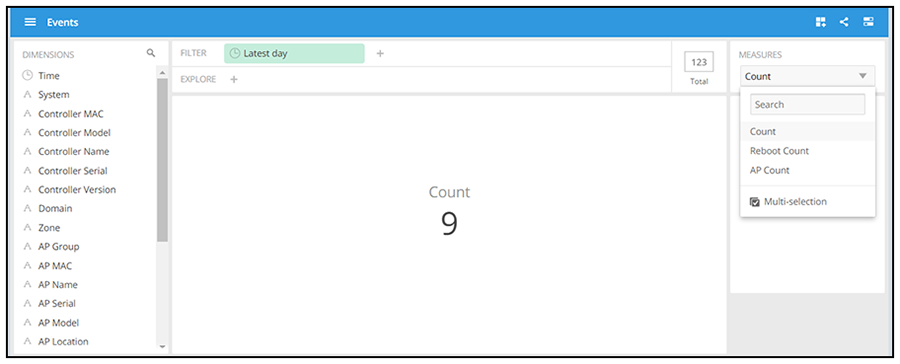
The Events cube allows you to view data about events that have occurred in your system.
Impacted Clients
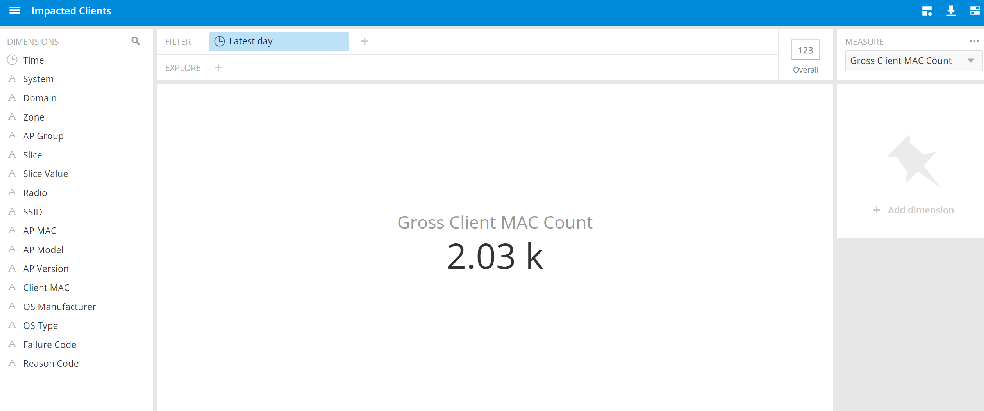
The Impacted Clients cube allows you to view information about the clients impacted by the incidents.
AP Inventory
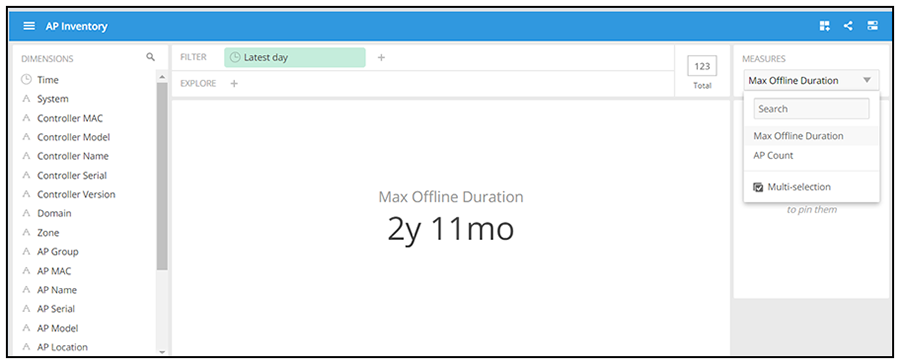
The AP Inventory cube allows you to view information about the various AP models your system uses.
AP Metrics
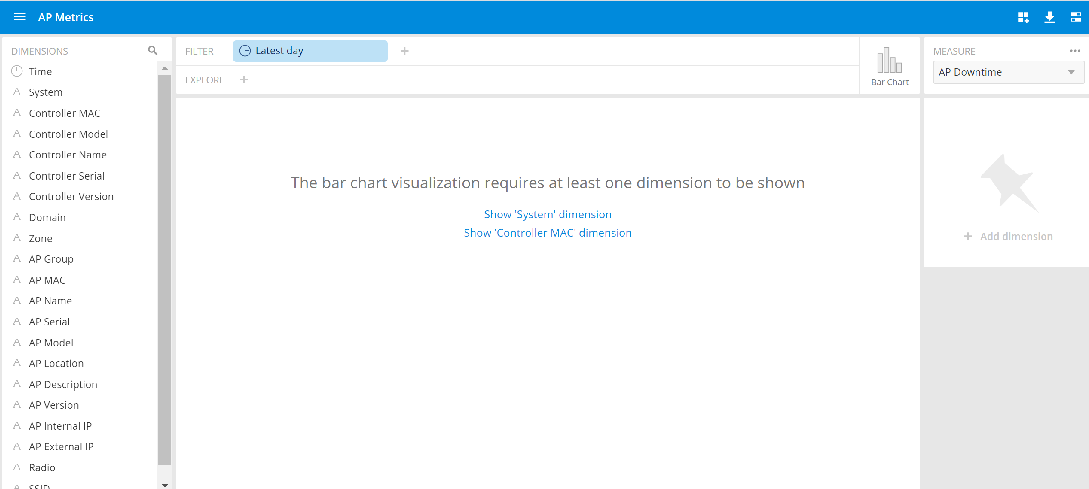
AP Connection Failures
The AP Connection Failures cube shows all the failures that have occurred in the AP or at any other level in the hierarchy of the AP.
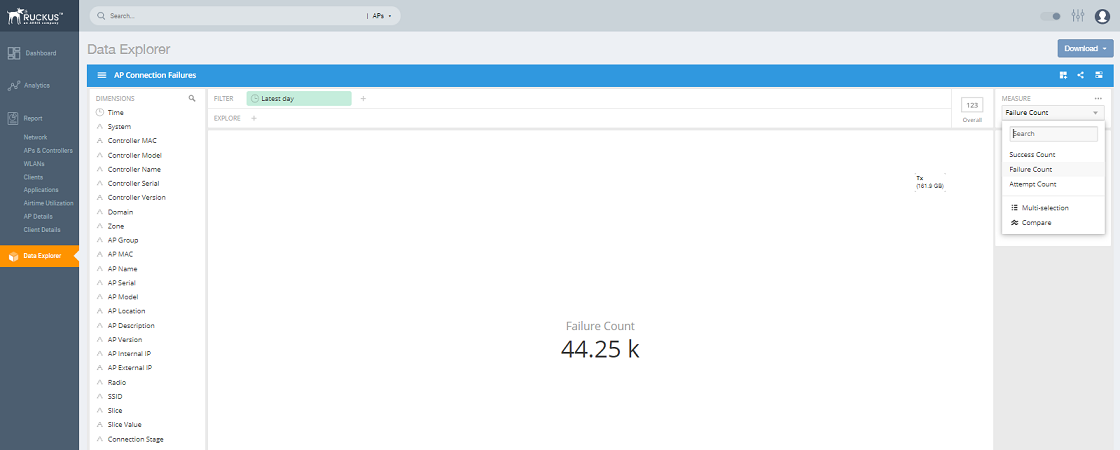
Client Connection Failures
The Client Connection Failures cube shows all client connectivity events, including connectivity failures, client joins and client roams.
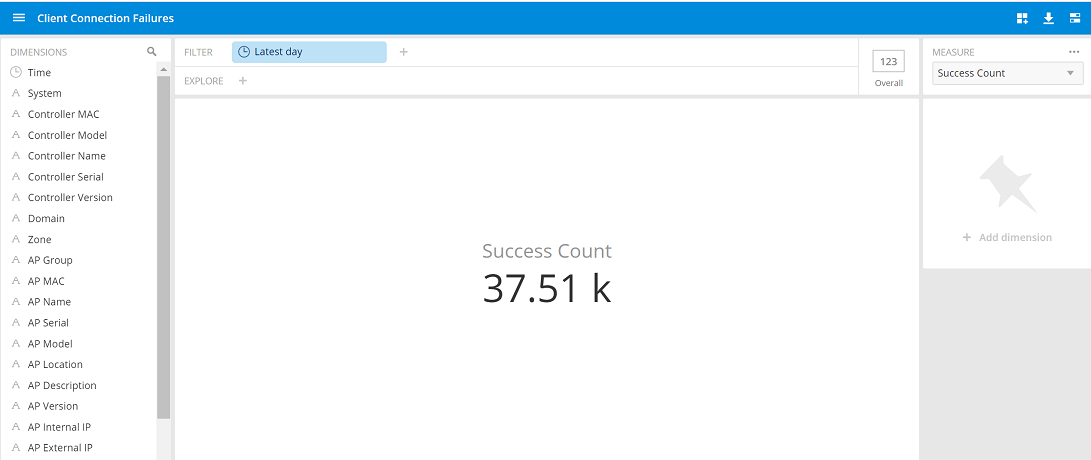
Client Connection Statistics
The Client Connection Statistics cube allows you to view any failure- and connection-related data for the client.
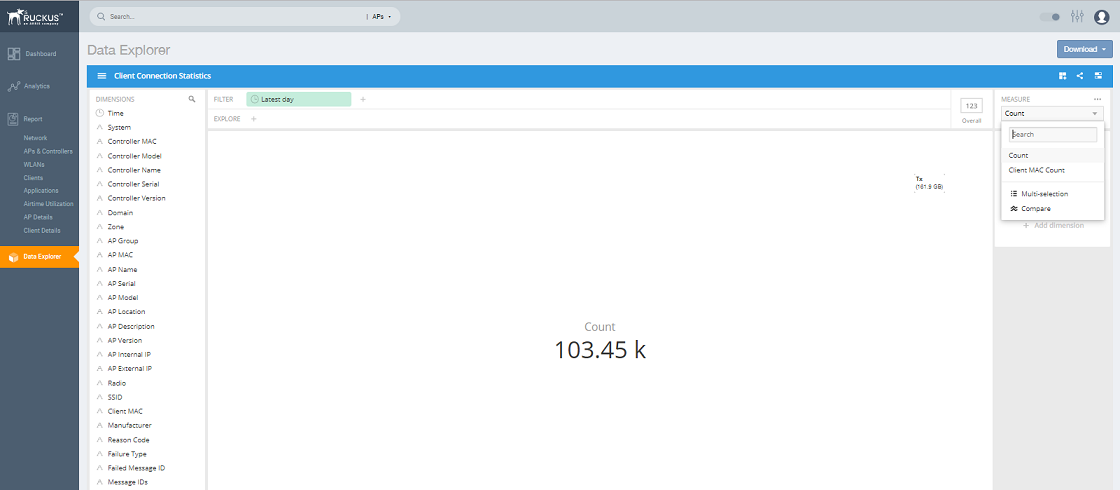
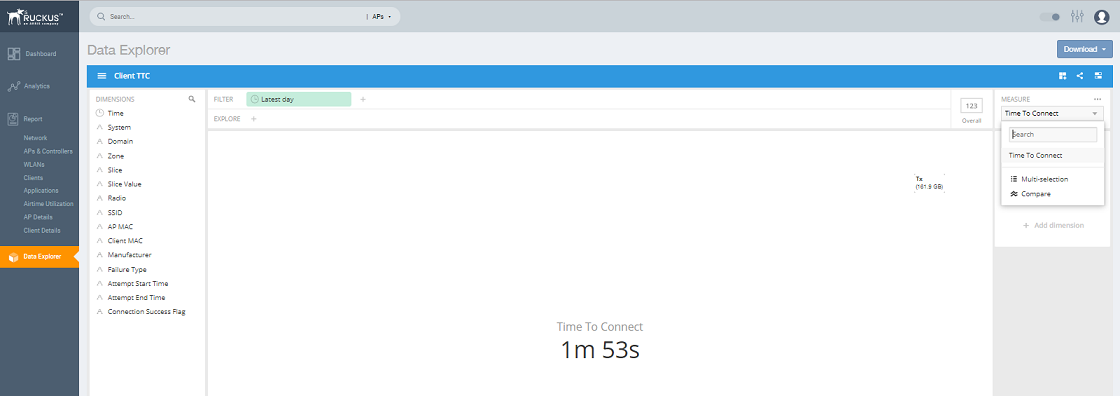
Client TTC
The Client TTC cube gives information about the time to connect (TTC) the client to the network.
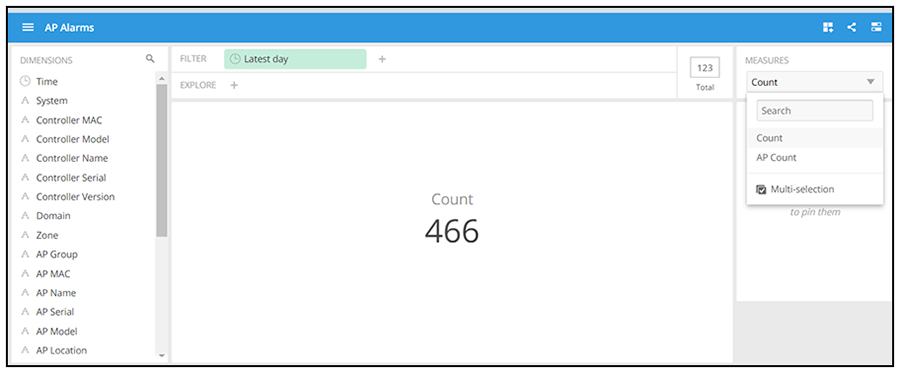
AP Alarms
The AP Alarms cube allows you to view information about alarms in your system.
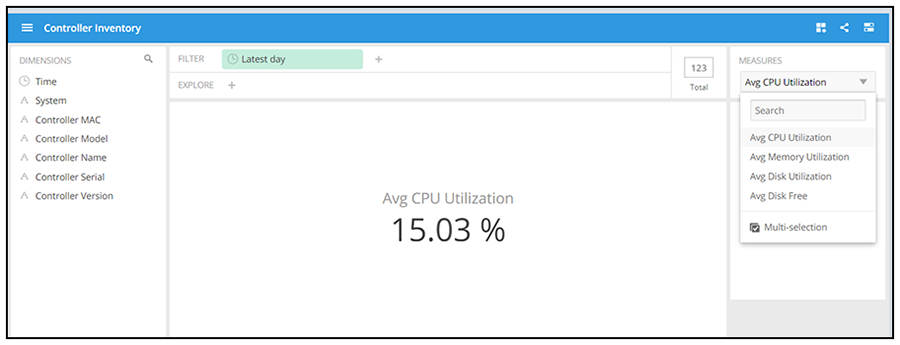
Controller Inventory
The Controller Inventory cube allows you to view CPU, memory, and disk utilization for the controllers in the system.
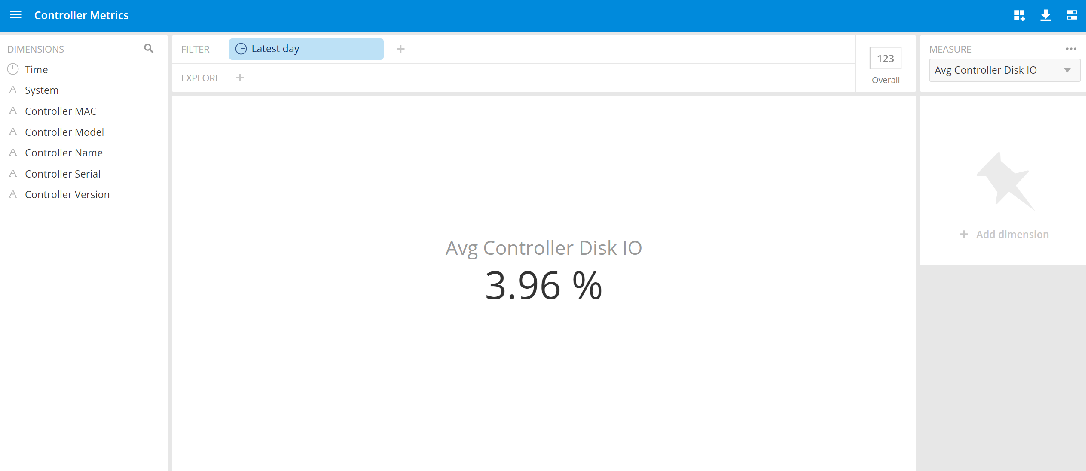
Controller Metrics
The Controller Metrics cube allows you to view the computed client metrics (such as client TTC) in your system.
Rogue APs
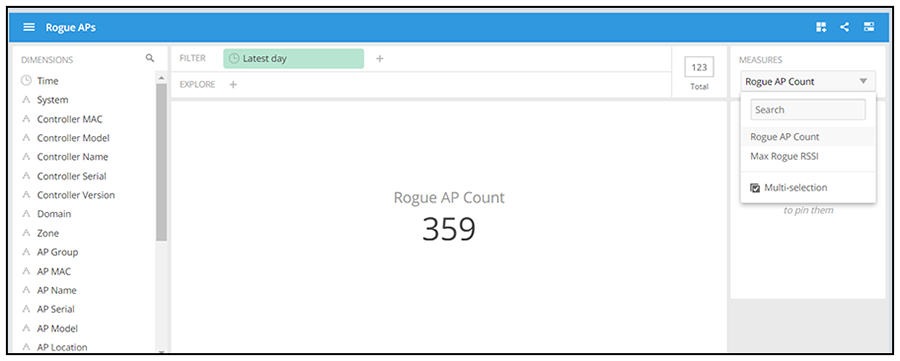
The Rogue APs cube allows you to view information about APs that have been flagged as "Rogue" because they cannot be identified by existing APs in your system.
Switch Network
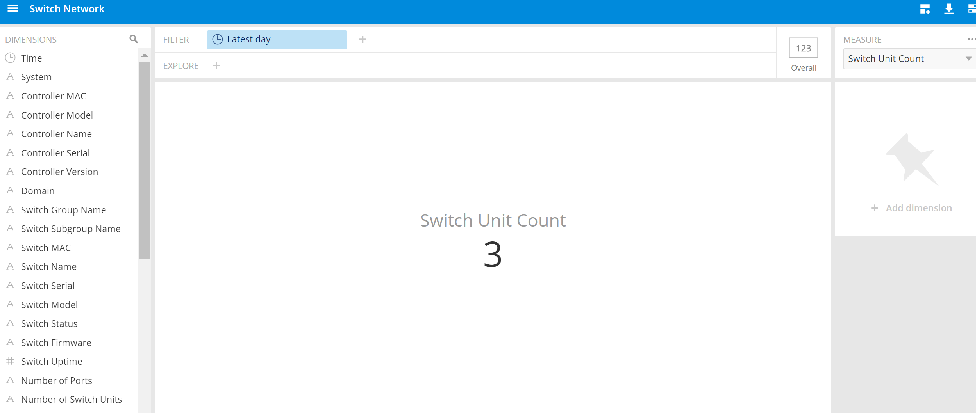
The Switch Network cube allows you to explore switch traffic data and its usage.
Wi-Fi Calling
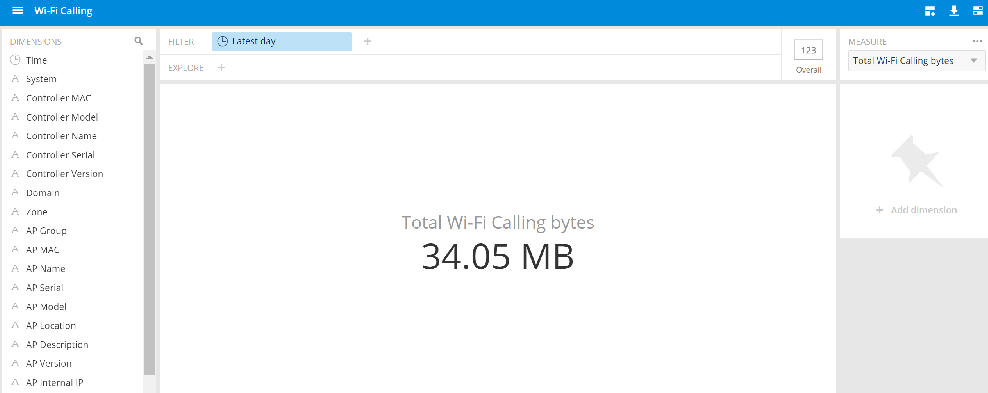
The Wi-Fi Calling cube allows you to view several Wi-Fi Calling KPIs such as the call duration, uplink and downlink bytes and so on.
The WiFi Calling cube allows you to view the metrics data for the Cloud controller.
