Creating a Data Explorer Dashboard
You can create custom dashboards in Data Explorer portion to focus on data you are interested in that encompasses any or all of the data cubes. These dashboards can be saved so that you can create reports for this unique data set whenever you wish.
- Click
+ Dashboard in the upper-right corner of
Data Explorer.
The New dashboard screen is displayed.
New Dashboard Screen 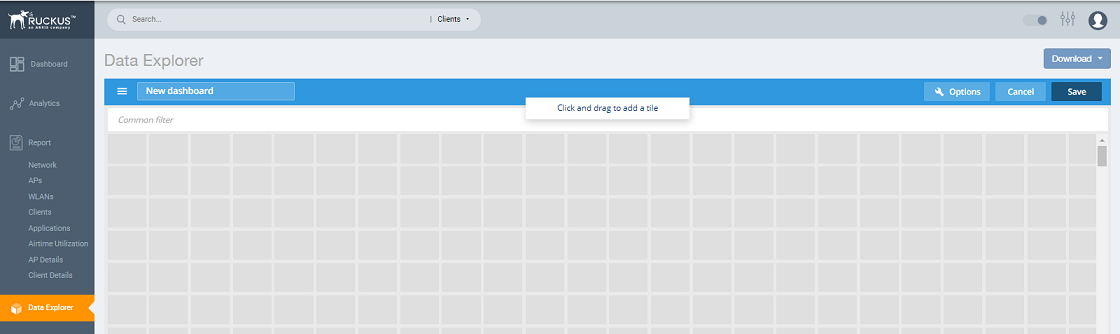
- Highlight
New dashboard and enter a name for the dashboard (for example, DemoDB, as shown in the following figure).
Naming the New Dashboard 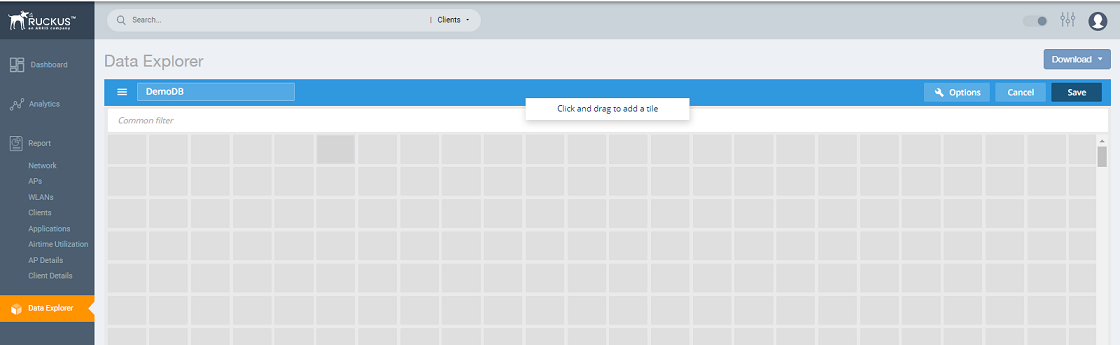
- Highlight any number of small boxes in the grid on the screen to add a tile to your dashboard. The
Select Content Type pane is displayed along with the new tile.
Adding a Tile to Your Dashboard 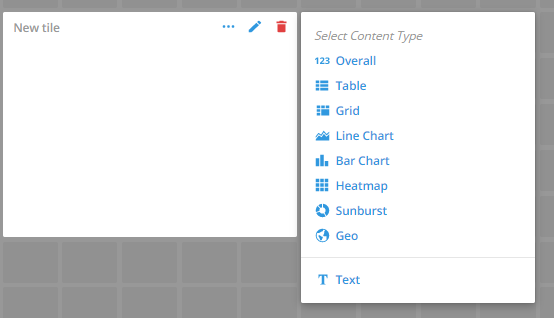
- Select a content type, for example, 123 Overall, as shown in the following figure
New Tile Options for 123 Overall Content Type 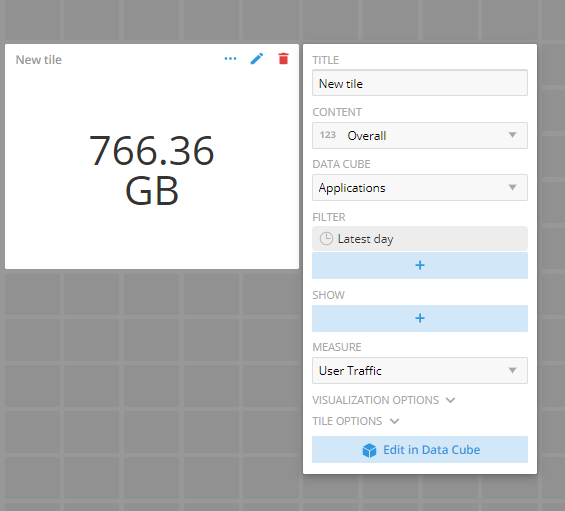
- Select options to customize the new tile.
Selecting Options for New Tile 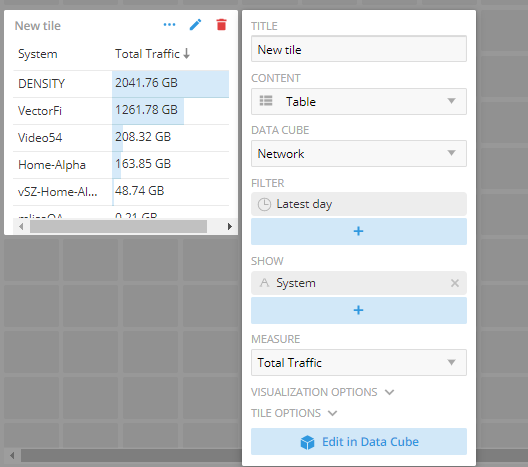
- Click
Edit in Data Cube to make changes to the new tile in the data cube.
Editing New Tile in the Data Cube 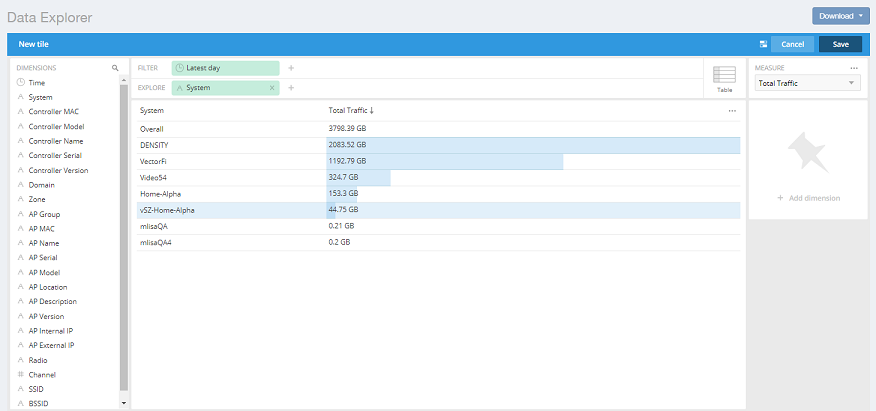
- To change the way the data is represented, pause the pointer over the Table icon and select a different content type, for example, Sunburst, as shown in the following figure.
Sunburst Representation of Tile in Data Cube 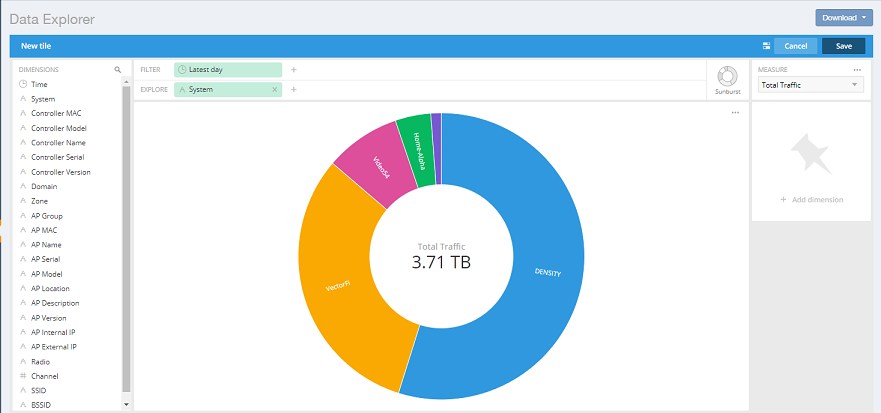
- Click
Save in the upper-right corner of the screen to save the new tile selections
You can as many tiles as you want to your dashboard.Note: The scheduler is only applicable for custom dashboards in Data Explorer.
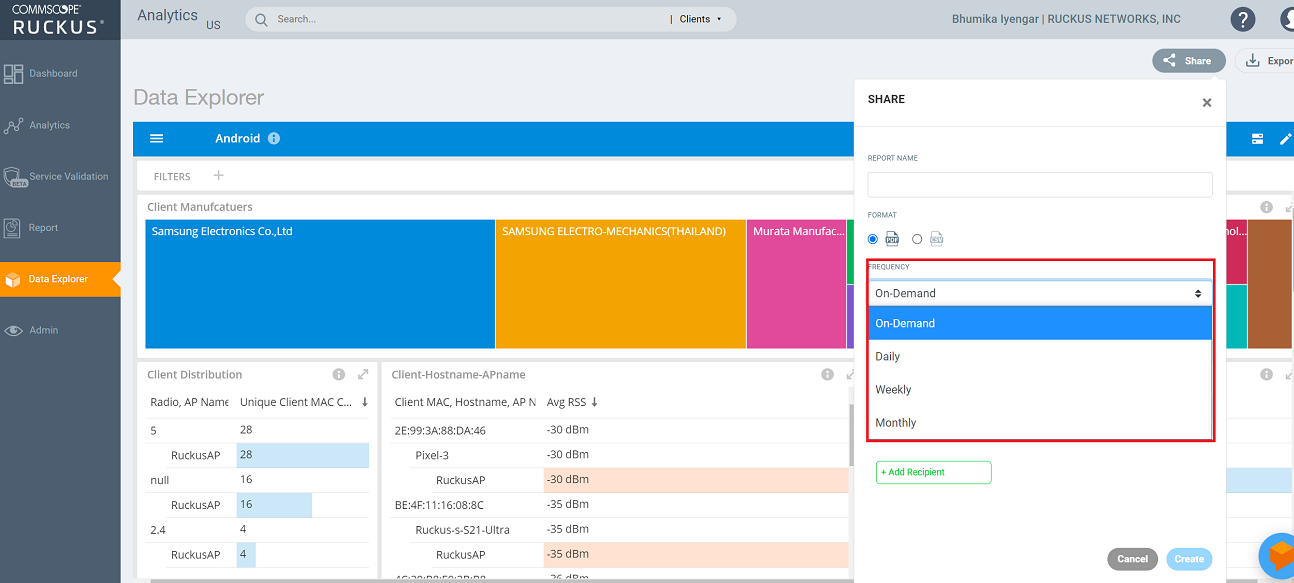
Custom Dashboard with Scheduler