Brand 360 Overview
Brand 360 is a data-sharing model that facilitates data analytics services for franchise business models in the hospitality sector. The key stakeholders in this model (brands/HSPs, LAN Service Providers (LSPs)/Tech Partners, and Property Owners) are bound by a service-level agreement (SLA) that sets the benchmark for the service quality and operations management of the network that is expected to be delivered by the LSPs.
Brand 360 Dashboard
- LSP: Provides a view of the network data and the predefined performance metrics for the LSPs (tech partners).
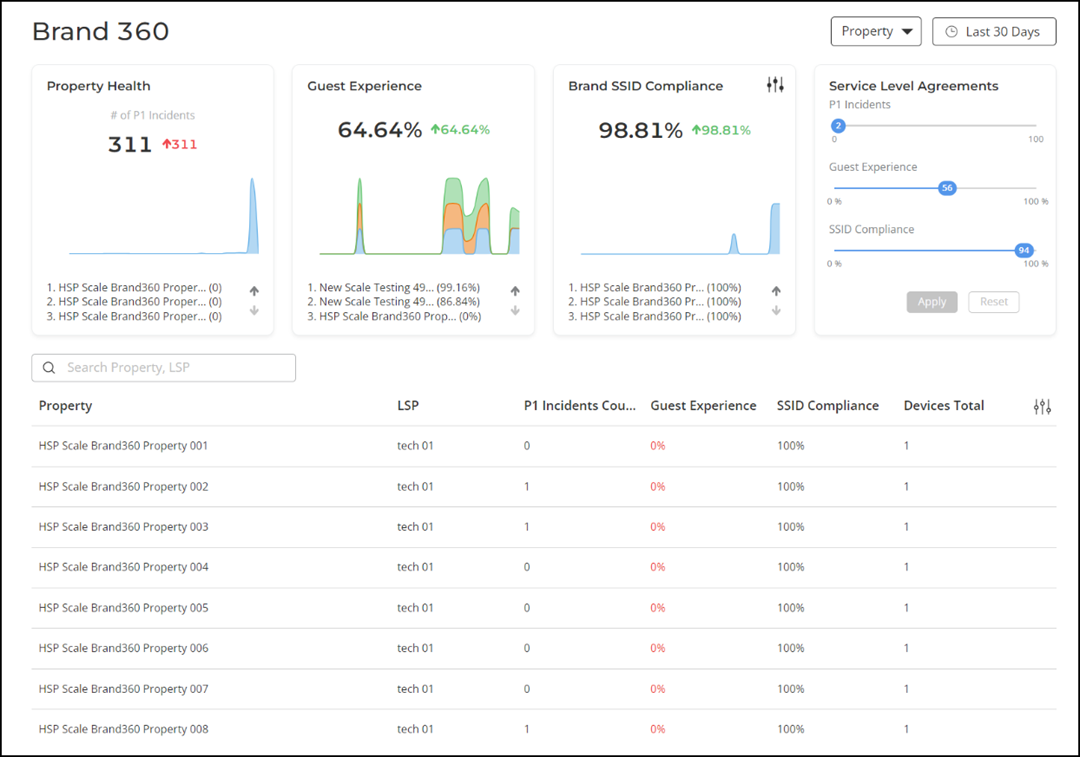
- Property: Provides a view of the network data and the predefined performance metrics for the properties managed by all LSPs (tech partners) in the brand.
- Settings: To align your RUCKUS One GUI user experience with the common language of your brand, the
brand may customize the names displayed on-screen for the following GUI
elements: Brand (default is Brand 360), LSP (default is LSP),
and Property (default is Property). For example, if you change the
Brand naming convention from Brand 360 to A#1 Hotel Chain, then the main
menu option name and the dashboard page title will change to A#1 Hotel
Chain. Click the
 icon to access these settings.
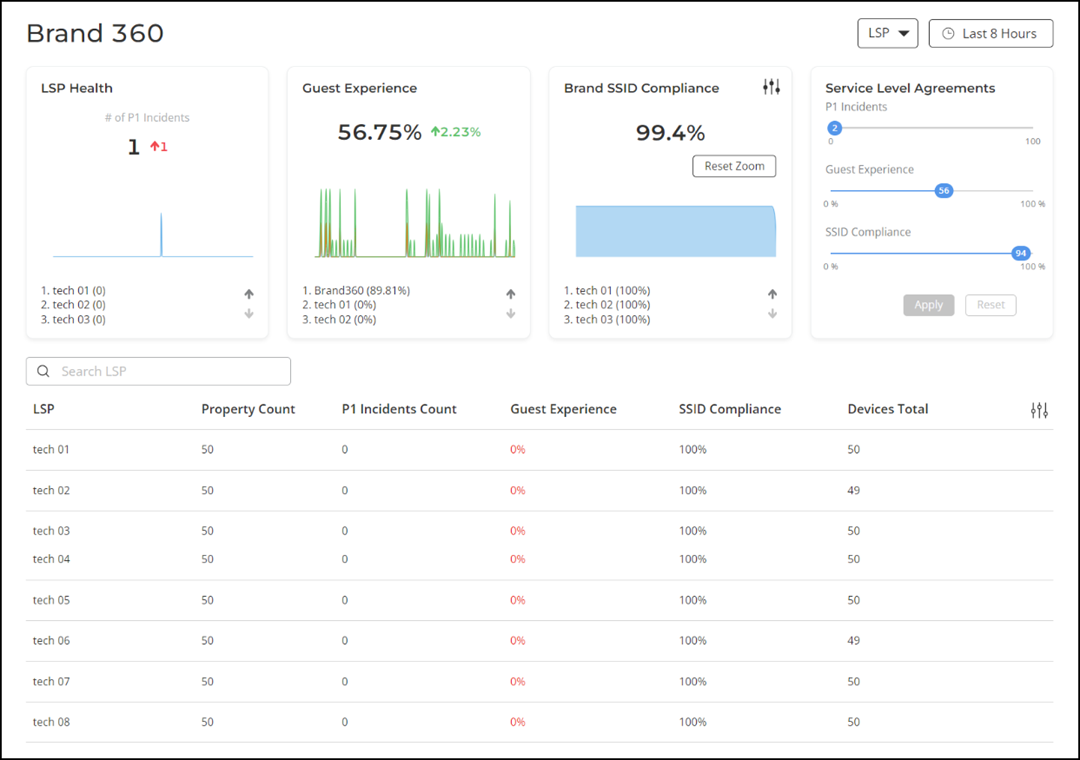
- LSP Health: The LSP Health tile, which is available when the LSP view type is selected, displays the total number of P1 incidents that have occurred in the network across all the LSPs.
- Property Health: The Property Health tile, which is available when the Property view type is selected, displays the total number of P1 incidents that have occurred in the network across all the properties.
- Guest Experience: Displays the weighted average for the "guest experience"-related metrics across all LSPs or properties. The guest experience score is determined by calculating the average percentage of three metrics: Time to Connect, Connection Success, and Client Throughput.
- Brand SSID
Compliance: Displays the percentage of the network properties
that conform to the SSID compliance rules.
- Company standards may
require specific naming conventions related to SSIDs too. The brand
can set the regular expression to validate brand SSID compliance
according to the specified standards. To set the regular expression,
click the icon, enter the SSID regular expression
in the Compliance Rules sidebar, and click
Save.Note: Regular expressions (example: ^[a-zA-Z0-9]{5}_GUEST$ ) must be compatible with Java standards.
- Company standards may
require specific naming conventions related to SSIDs too. The brand
can set the regular expression to validate brand SSID compliance
according to the specified standards. To set the regular expression,
click the
- Delta counter: Displays the difference in value compared to the previous time period indicating positive or negative change with respect to the metrics.
- Time-series graph: Displays the value of respective metrics over time. Pausing your cursor over the time-series graph at a particular point displays the data at that time and date.
- Selector arrow: The top three best performing and three underperforming LSPs or properties with respect to each metric are displayed. The selector arrow can be used to toggle the view to display the three best performers and the three underperformers. The selector arrow is available only if there are more than three LSPs or properties.
The brand can customize the SLA threshold for the metrics according to the brand's requirements. Every time a new SLA threshold is set, the values displayed on the table change simultaneously as the metrics that meet the updated SLA are considered for analytics. To customize the SLA, in the Service Level Agreements panel, move the slider to adjust the threshold value of each metric and click Apply.
| Header Field | Description |
|---|---|
| LSP | Displays the name of the account that is associated with the brand account as a partner. |
| Property Count | Displays the number of properties managed by the LSPs. |
| P1 Incidents Count | Displays the number of critical-severity incidents that have occurred in the network. |
| Guest Experience | Displays the average percentage for the "guest experience"-related metrics for each LSP. |
| SSID Compliance | Displays the percentage of the network properties that conform to the SSID compliance rules. |
| Devices Total | Displays the total number of devices in the network. |
| Header Field | Description |
|---|---|
| Property | Displays the properties managed by the LSPs. |
| Property ID | Displays the unique brand code for each property, so you can quickly identify the correct one when names are similar. If no code is available, this field appears empty (displays --). |
| LSP | Displays the name of the tech partner account that is associated with the brand account. |
| P1 Incidents Count | Displays the number of critical-severity incidents that have occurred in the network. |
| Guest Experience | Displays the average percentage for the "guest experience"-related metrics for each property. |
| SSID Compliance | Displays the percentage of the network properties that conform to the SSID compliance rules. |
| Devices Total | Displays the total number of devices in the network. |