| User Authentication |
- Radio: The
distribution of impacted clients who connected to 5 GHz and
2.4 GHz radios.
- WLAN: The different
WLANs to which the impacted clients are connected.
- Client Manufacturer: The distribution of
device manufacturers.
- Reason: The
breakdown of various failure reasons experienced by the
impacted clients.
. |
- Authentication
Failure Ratio: A time series chart that shows the failure
ratio over time. The chart includes data for 6 hours before
and 6 hours after (if available) the incident.
- Clients: Three
types of time series data: a line for new clients, a line
for connected clients, and an area chart for impacted
clients.
- Failure counts: A
time series chart with three types of raw failure counts:
Authentication Failures, Authentication Attempts, and Total
Failures, which includes the total of all types of
connection failures (authentication, association, EAP, DHCP,
and so on) that were observed during this period.
|
| EAP |
- Radio: The
distribution of impacted clients who connected to 5 GHz and
2.4 GHz radios.
- WLAN: The different
WLANs to which the impacted clients are connected.
- Client Manufacturer: The distribution of
device manufacturers.
- Reason: The
breakdown of various failure reasons experienced by the
impacted clients.
|
- EAP Failure Ratio:
A time series chart that shows the failure ratio over time.
The chart includes data for 6 hours before and 6 hours after
(if available) the incident.
- Clients: Three
types of time series data: a line for new clients, a line
for connected clients, and an area chart for impacted
clients.
- Failure counts: A
time series chart with three types of raw failure counts:
EAP Failures, EAP Attempts, and Total Failures, which
includes the total of all types of connection failures
(authentication, association, EAP, DHCP, and so on) that
were observed during this period.
|
| Association |
- Radio: The
distribution of impacted clients who connected to 5 GHz and
2.4 GHz radios.
- WLAN: The different
WLANs to which the impacted clients are connected.
- Client Manufacturer: The distribution of
device manufacturers.
- Reason: The
breakdown of various failure reasons experienced by the
impacted clients.
|
- Configuration
Change: chart with drop-down table displaying configuration
changes that are relevant to the specific incident.
- Association Failure
Ratio: A time series chart that shows the failure ratio over
time. The chart includes data for 6 hours before and 6 hours
after (if available) the incident.
- Clients: Three
types of time series data: a line for new clients, a line
for connected clients, and an area chart for impacted
clients.
- Failure counts: A
time series chart with three types of raw failure counts:
Association Failures, Association Attempts, and Total
Failures, which includes the total of all types of
connection failures (authentication, association, EAP, DHCP,
and so on) that were observed during this period.
|
| DHCP |
- Radio: The
distribution of impacted clients who connected to 5 GHz and
2.4 GHz radios.
- WLAN: The different
WLANs to which the impacted clients are connected.
- Client Manufacturer: The distribution of
device manufacturers.
- Reason: The
breakdown of various failure reasons experienced by the
impacted clients.
|
- Configuration
Change: chart with drop-down table displaying configuration
changes that are relevant to the specific incident.
- DHCP Failure Ratio:
A time series chart that shows the failure ratio over time.
The chart includes data for 6 hours before and 6 hours after
(if available) the incident.
- Clients: Three
types of time series data: a line for new clients, a line
for connected clients, and an area chart for impacted
clients.
- Failure counts: A
time series chart with three types of raw failure counts:
DHCP Failures, DHCP Attempts, and Total Failures, which
includes the total of all types of connection failures
(authentication, association, EAP, DHCP, and so on) that
were observed during this period.
|
| RADIUS |
- Radio: The
distribution of impacted clients who connected to 5 GHz and
2.4 GHz radios.
- WLAN: The different
WLANs to which the impacted clients are connected.
- Client Manufacturer: The distribution of
device manufacturers.
- Reason: The
breakdown of various failure reasons experienced by the
impacted clients.
|
- Configuration
Change: chart with drop-down table displaying configuration
changes that are relevant to the specific incident.
- Radius Failures: A time series chart that
shows the failure ratio over time. The chart includes data
for 6 hours before and 6 hours after (if available) the
incident.
- Clients: Three
types of time series data: a line for new clients, a line
for connected clients, and an area chart for impacted
clients.
- Failure counts: A
time series chart with three types of raw failure counts:
RADIUS Failures, RADIUS Attempts, and Total Failures, which
includes the total of all types of connection failures
(authentication, association, EAP, DHCP, and so on.) that
were observed during this period.
|
| Time to Connect |
- Radio: The
distribution of impacted clients who connected to 5 GHz and
2.4 GHz radios.
- WLAN: The different
WLANs to which the impacted clients are connected.
- Client Manufacturer: The distribution of
device manufacturers.
- Reason: The
breakdown of various failure reasons experienced by the
impacted clients.
|
- Configuration
Change: chart with drop-down table displaying configuration
changes that are relevant to the specific incident.
- Time to Connect
Failure Ratio: A time series chart that shows the failure
ratio over time. The chart includes data for 6 hours before
and 6 hours after (if available) the incident.
- Clients: Three
types of time series data: a line for new clients, a line
for connected clients, and an area chart for impacted
clients.
- Time to Connect (By stage): A time
series chart that displays the time to connect based on
various stages of the connection such as authentication,
association, EAP, Radius, and DHCP. Pause your cursor over
the graph for more information.
|
| RSSI |
- Radio: The
distribution of impacted clients who connected to 5 GHz and
2.4 GHz radios
- WLAN: The different
WLANs to which the impacted clients are connected.
- Client Manufacturer: The distribution of
device manufacturers.
- Reason: The
breakdown of various failure reasons experienced by the
impacted clients.
|
- Configuration
Change: chart with drop-down table displaying configuration
changes that are relevant to the specific incident.
- RSSI Quality by
Clients: Three types of time series data: a line for new
clients, a line for connected clients, and an area chart for
impacted clients.
- RSSI Distribution:
The RSSI distribution over a period of time.
|
| Network Latency |
— |
- Ping Latency:
Average time, in milliseconds, for the controller nodes to
transmit and receive the packets. Maximum, average, and
minimum latency trends are plotted on the graph.
- Controller-1: CPU,
memory and input-output usage of the controller node over
time is displayed.
- Controller-2: CPU,
memory and input-output usage of the other controller node
over time is displayed.
|
| Reboot |
- AP Model: Distribution of impacted AP
models.
- AP Firmware: Distribution of impacted AP
versions.
- Reason by AP: Distribution of reasons
for failure that caused the AP reboot.
- Reason by Event: Distribution of reasons
for failure that caused the AP reboot and triggered related
events.
|
- Reboot by System: A time series chart
that displays the number reboot events.
- Connected Clients: A time series chart
that displays the number of clients connected at that point
in time.
- Rebooted APs: A time series chart that
displays the number of APs that were rebooted at a point in
time.
|
| High AP-controller connection failures |
- AP Model: Displays the percentage of
failure that impacted various AP models
- AP Firmware: Displays the number of
failures that impacted various AP firmware versions
- Event Type: Displays the percentage of
failures that were caused by various events
- Reason: Lists the reasons that caused
the incident
|
- AP-Controller Disconnections: A time
series chart that displays the number of disconnections
between the AP and controller over time.
- Event Count: A time series chart that
displays the total event count for the following events:
Heartbeat Lost, Connection Lost, Reboot By System, and
Reboot By User. When an event is generated for the above
mentioned conditions, it is plotted in this graph. You can
select the checkbox to displays only one or more of the
events.
|
| Channel Distribution |
— |
- AP Distribution by Channel: Heatmap that
displays the AP count over time, across channels.
- Rogue Distribution by Channel: A time
series chart that displays the number of rogue APs across
channels.
|
| VLAN Mismatch |
- Impacted switche: Displays the number of
switches impacted by VLAN mismatch
- Mismatched VLAN: Displays the number of
VLANs that are mismatched
|
Incident
identifies incorrect VLAN configurations between switches and
wired devices due to which data transmission could be impaired.
|
| Memory Utilization |
— |
Incident identifies memory leaks within the switch. The time series
chart displays high memory utilization by a switch against the
threshold set. Pause your cursor over the graph to determine the
switch memory used against the threshold set, at a time. The Detected
Time identifies when the memory leak happened and based
on the threshold set, a Projected
Time is calculated and plotted on the graph. Projected
time is predicted; it is the time by when the switch will run
out of available memory. Contact RUCKUS Support for
assistance. You can select the checkbox to displays only Memory Used
or Threshold
graphs. |
| PoE Power |
- Impacted Switch: Displays the number of
switches impacted by the denial of PoE power
- Impacted PoE port: Displays the number
of PoE ports that are impacted by the denial of PoE
power.
|
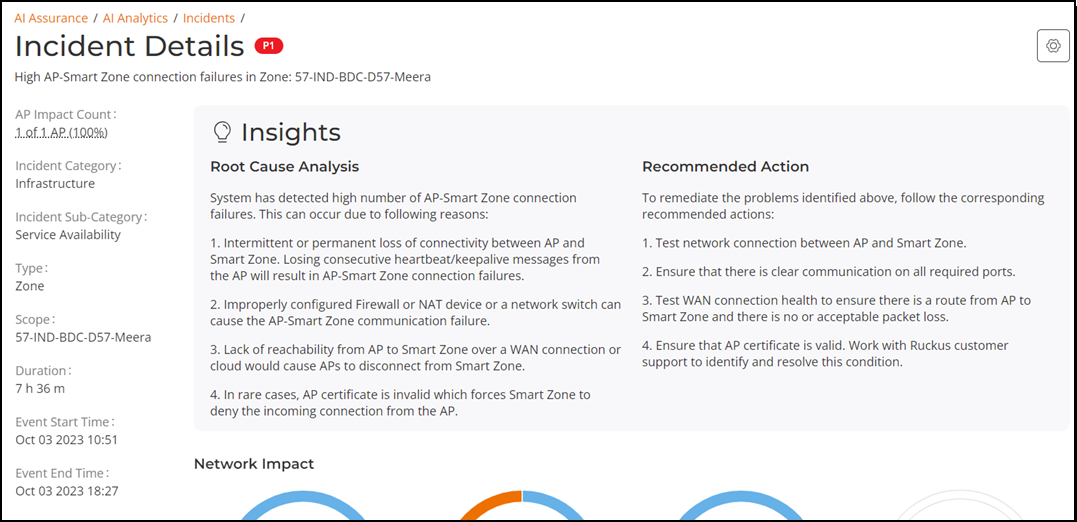
The Impacted
Switches table displays detailed information about the
switch (name, MAC address, port) for which PoE power was
denied. |
| AP PoE Underpowered |
- AP Model: Displays the percentage of
failure due to insufficient PoE power that impacted an AP
model
- AP Firmware: Displays the percentage of
failure due to insufficient PoE power that impacted an AP
firmware version
|
- AP POE impact: Displays the number of
APs impacted at a time, due to insufficient power available
on the PoE port
- Impacted AP: Displays the list of APs
impacted by failure due to insufficient PoE power within the
network
|
| AP Ethernet Auto-negotiation |
- AP Model: Displays the distribution of
AP models affected by physical link speed or duplex mismatch
between the AP and the upstream/connected device. Pause your
cursor over the sliced segments of the donut chart to view
the count of impacted APs for each model. The summary line
below the chart indicates the total number of AP models
impacted by the incident.
- AP Firmware: Displays the distribution
of AP firmware versions affected by the incident. Pause your
cursor over the sliced segments of the donut chart to view
the count of impacted APs for each firmware version. The
summary line below the chart indicates the number of AP
firmware versions impacted by the incident.
|
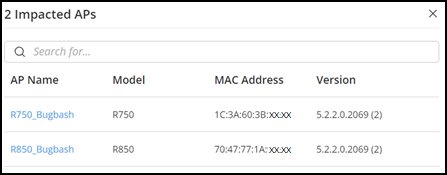
- Impacted APs:
Displays a time-series graph to indicate the number of APs
impacted by the incident over time.
- Impacted AP
Details: Displays the list of APs impacted by the incident
in a table format. The table includes the following columns:
- AP Name: The name of the impacted AP.
- MAC Address: The MAC address of the impacted
AP.
- AP Group: The group to which the AP belongs.
- Interface: The specific network interface on the
AP that experienced the incident.
- AP Port Capability: The maximum supported
physical link speed and duplex mode for the AP’s
Ethernet port.
- Upstream Port Capability: The maximum supported
physical link speed and duplex mode for the port
on the upstream device connected to the AP
- Event Time: The time at which the incident
occurred.
|
| Airtime Busy |
- Average Airtime Busy: Displays the
average percentage of airtime busy and peak percentage of
airtime busy. Pause your cursor over the sliced segments of
the donut chart to view average airtime Rx, Tx, Idle, and
Busy over the incident period.
- Rogue APs: Displays the distribution of
rogue APs across channels. It also displays the channel with
the highest number of rogue APs. Pause your cursor over the
sliced segments of the donut chart to view the number of
rogue APs in each channel. If the donut chart is empty, you
may need to enable Rogue AP detection in the venue.
- Rx PHY
Errors: Displays the distribution of PHY errors across
impacted APs over the incident period.
- AP Model:
Displays the distribution of impacted AP models.
|
Airtime Utilization for the specified radio band: Displays a timeline
graph to indicate average airtime utilization for the respective
radio band (2.4 GHz, 5 GHz, or 6 GHz) over the incident period. The
data is aggregated over impacted APs only. Pause your cursor at any
instance on the timeline graph to view the airtime utilization
details at a specific date and time during the incident. |
| Airtime Tx |
- Average Airtime Tx: Displays the average
time and peak time spent by the radio in sending the data.
Pause your cursor over the sliced segments of the donut
chart to view average airtime Rx, Tx, Idle, and Busy values
over the incident period.
- Average % of
Mgmnt. frames: Displays the distribution of data frames as
against management frames over the incident period.
- Average % of
MC/BC traffic: Displays the distribution of Unicast traffic,
Multicast traffic, and Broadcast traffic over the incident
period.
- Average Peak No. of Clients per AP:
Displays the number of clients per AP. Pause your cursor
over the sliced segments of the donut chart to view the
number of clients in each bin.
- Less
than 30 clients over the incident period.
- 31
through 50 clients over the incident period.
- More
than 50 clients over the incident period.
|
Airtime Utilization for the specified radio band: Displays a timeline
graph to indicate average airtime utilization for the respective
radio band (2.4 GHz, 5 GHz, or 6 GHz) over the incident period. The
data is aggregated over impacted APs only. Pause your cursor at any
instance on the timeline graph to view the airtime utilization
details at a specific date and time during the incident
period. |
| Airtime Rx |
- Average Airtime Rx: Displays the average
and peak time spent by the radio in receiving the data.
Pause your cursor over the sliced segments of the donut
chart to view average airtime Rx, Tx, Idle, and Busy values
over the incident period.
- Average Peak No. of Clients per AP:
Displays the number of clients in each bin. Pause your
cursor over the sliced segments of the donut chart to view
the number of clients in each bin.
- Less
than 30 clients over the incident period.
- 31
through 50 clients over the incident period.
- More
than 50 clients over the incident period.
- AP Model:
Displays the distribution of impacted AP models.
|
Airtime Utilization for the specified radio band: Displays a timeline
graph to indicate average airtime utilization for the respective
radio band (2.4 GHz, 5 GHz, or 6 GHz) over the incident period. The
data is aggregated over impacted APs only. Pause your cursor at any
instance on the timeline graph to view the airtime utilization
details at a specific date and time during the incident. |
| TCP-SYN DDoS The
recommended action to remediate the issue is to configure the
TCP SYN DDoS protection threshold on the affected port to a
value less than 1000 or adjust it based on the deployment
requirements. |
- Switch Distribution: Displays the
distribution of switches by DDoS attack detection status.
Pause your cursor over the sliced segments of the donut
chart to view the count of impacted and non-impacted
switches. The total number of switches is shown at the
center of the chart, with a summary line below providing an
impact overview.
- Impacted Port
Count: Displays a time-series graph tracking the detection
of TCP-SYN flood attacks on switch ports over time. The
X-axis represents the time period, while the Y-axis shows
the number of impacted switch ports.
|
Impacted Switches: Provides detailed information about switches, in a
table format, affected by TCP-SYN flood attacks. The table includes
the following columns:
- Switch Name:
The name of the impacted switch.
- Switch MAC:
The MAC address of the impacted switch.
- Switch
Serial: The serial number of the impacted switch.
- Port Numbers:
Lists the ports affected by the attack.
- Action:
Includes an option to copy the affected port numbers to the
clipboard for quick reference.
|
| Congestion Note: This
incident requires switches to run FastIron firmware version
10.0.10f or later as a prerequisite. |
- Details: Displays switch-specific information, including the
name, model, MAC address, and firmware version of the switch
where port congestion has been detected.
- Impacted Port Count: Displays a time-series graph tracking
port congestion detected in the switch over time. The X-axis
represents the time period, while the Y-axis shows the
number of congested ports.
Note: A LAG (Link Aggregation Group) is considered as a single port,
regardless of the number of member ports it contains. If the LAG
name is modified, a new row is added to the same incident,
provided congestion is detected on the renamed LAG.
Note: Stacking ports are excluded from congestion detection and are
not considered when generating incidents.
|
Impacted Ports: Displays detailed information about ports, in a table
format, where congestion has been detected, including port and peer
device details.
- Port
Number/LAG: The switch port or Link Aggregation Group (LAG)
on the switch where congestion is detected.
- Peer Device:
The peer device connected to the congested port or LAG.
|
| Uplink Congestion Note: This incident requires switches to run FastIron firmware
version 10.0.10f or later as a prerequisite. |
- Details - Impacted switch: Displays the total number of
impacted switches in the switch group.
- Details - Impacted uplink ports: Displays the total number
of impacted uplink ports in the switch group.
- Congested Port Count: Displays a time-series graph tracking
uplink port congestion detected in the switch group over
time. The X-axis represents the time period, while the
Y-axis shows the number of congested uplink
connections.
Note: A LAG (Link Aggregation Group) is considered as a single port,
regardless of the number of member ports it contains. If the LAG
name is modified, a new row is added to the same incident,
provided congestion is detected on the renamed LAG.
|
Impacted Switches: Provides detailed information
about switches where uplink port congestion has been detected,
including switch and peer device details.
- Switch Name:
The name of the impacted switch.
- Switch MAC:
The MAC address of the impacted switch.
- Switch
Port/LAG: The switch port or Link Aggregation Group (LAG) on
the switch where congestion is detected.
- Peer Port:
The port on the peer device connected to the congested
switch port or LAG.
- Peer Device:
The peer device connected to the impacted switch.
- Peer Device
MAC: The MAC address of the peer device connected to the
impacted switch.
|
| Loop Detection Note: This
incident requires switches to run FastIron firmware version
10.0.10f_cd2 or later as a prerequisite. |
- Switch Distribution: Displays the
distribution of switches by L2 loop detection status. Pause
your cursor over the sliced segments of the donut chart to
view the count of impacted and non-impacted switches. The
total switch count is shown at the center of the chart, with
an impact summary displayed below the chart.
- Impacted Switch Models: Displays the distribution of
impacted switches by model. The center of the chart
indicates the total number of impacted switch models, and a
summary line below highlights the most affected model.
- Impacted Switch Firmware: Displays the distribution of
impacted switches by firmware version. The center displays
the total number of impacted firmware instances, with a
summary below indicating the most affected version.
|
VLANs: Displays the VLANs where L2 loops have been
detected, including information about affected switches and VLAN
IDs. The table includes the following columns: |
| LLDP Status Note: This
incident requires switches to run FastIron firmware version
10.0.10g or later as a prerequisite. |
- Switch Distribution: Displays the
distribution of switches by LLDP running status. This chart
helps identify the switches that are affected by LLDP being
disabled or misconfigured, potentially resulting in reduced
network visibility and incomplete topology mapping for AI
analysis. Pause your cursor over the sliced segments of the
donut chart to view the count of impacted and non-impacted
switches. The total switch count is shown at the center of
the chart, with an impact summary displayed below the
chart.
- Impacted Switch Models: Displays the
distribution of the specific switch models on which LLDP is
disabled or not fully operational. Pause your cursor over
the sliced segments of the donut chart to view the count of
impacted switches per model. The center of the chart
indicates the total number of impacted switch models, and a
summary line below highlights the most affected model.
- Impacted Switch Firmware: Displays the
distribution of impacted firmware versions on switches where
LLDP is disabled or misconfigured. Pause your cursor over
the sliced segments of the donut chart to view the count of
impacted firmware versions. The center displays the total
number of impacted firmware instances, with a summary below
indicating the most affected version.
|
Impacted Switches: Provides detailed information
about switches impacted by LLDP being disabled or misconfigured.
- Switch Name:
The name of the impacted switch where LLDP is not fully
operational.
- Switch
Serial: The serial number of the impacted switch for
identification and support tracking.
- Switch MAC:
The MAC address of the impacted switch.
- Impacted
Reason: Describes the LLDP configuration issue detected on
the switch, such as global LLDP disablement, port-level
disablement, unidirectional operation (transmit-only or
receive-only), and so on.
- Port Details:
The affected ports where LLDP is disabled or misconfigured,
providing visibility into specific interfaces missing
neighbor discovery data.
|
| Port Flap Note: This
incident requires switches to run FastIron firmware version
10.0.10g or later as a prerequisite. |
- Switch
Details: Provides detailed information about the switch on
which one or more ports have experienced port flapping.
- Switch Name: The name of the switch where port
flapping was detected.
- Switch Model: The hardware model identifier of the
switch.
- Switch MAC: The MAC address of the switch.
- Switch Firmware Version: The firmware version
currently running on the switch.
- Number of Ports: The total number of ports
available on the switch.
- Ports
with Flap: The number of ports on the switch that
have experienced port flapping.
- Impacted Port
Count: Displays a time-series graph tracking port flaps
detected on the switch over time. The X-axis represents the
time period, while the Y-axis shows the number of ports that
experienced flapping.
|
Impacted Ports: Provides detailed information, in
a table format, about each port on the switch that experienced
flapping. It helps you pinpoint exactly which interfaces were
unstable and offers visibility into their configuration, and
connected devices. An actionable message is also displayed under the Impacted
Ports section. Clicking the switch name redirects you to the Reports
tab of the Switch List page for a deeper
analysis of the affected switch. You can export
the Impacted Ports table in the CSV format by clicking the
 icon. icon. The table includes the
following columns:
- Port ID: The
unique identifier of the port that experienced
flapping.
- Port Type:
Indicates the physical medium of the port, such as fiber or
copper.
- VLAN: The
VLANs associated with the port.
- PoE Detail:
The Power over Ethernet (PoE) operational state of the
port.
- Remote Device
Type: The type of remote device connected to the port.
- Remote Device
Port: The port identifier of the remote device.
- Remote Device
Name: The system name of the connected remote device. If the
device is managed by RUCKUS One or SmartZone, the name is
displayed as a hyperlink that redirects to the
Reports page for the device.
- Last Flap
Time Stamp: The most recent timestamp when flapping was
detected on the port.
|