The Network Health test report provides
granular information about the test result which aids in better network analysis. It
provides a step-by-step analysis of the various connection stages the AP has to go through
before establishing network connectivity, there by, being able to identify the reason for
failure or error if there is one.
The Network Health Report consists of
the following components:
Overview tab
Details tab
Note: One year is the data retention period for all Network Health tests and
reports.
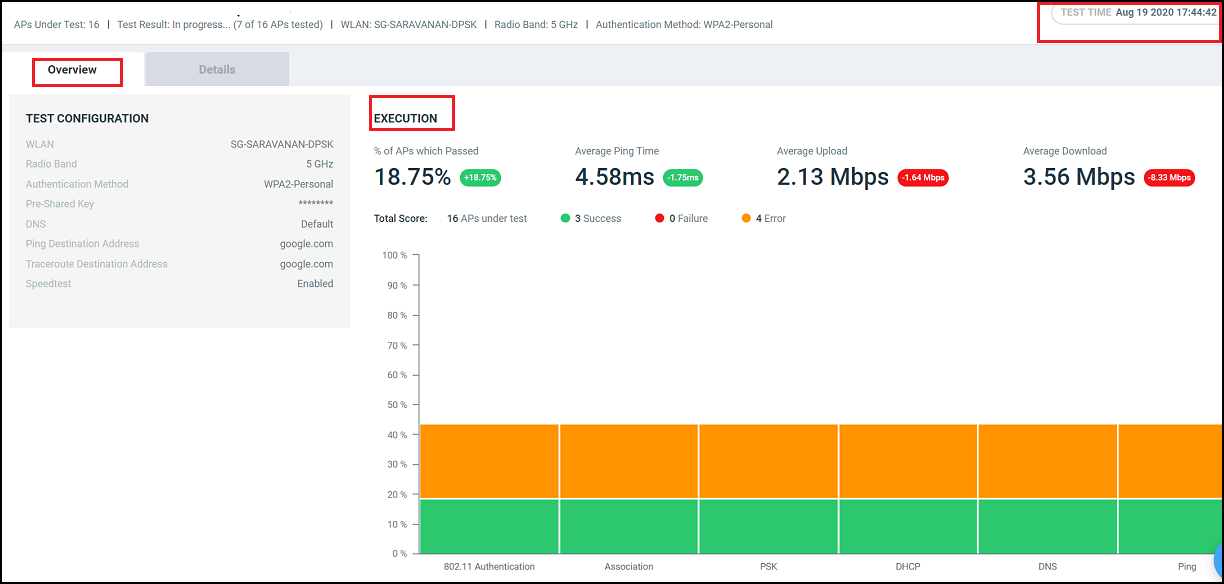
Overview Tab
The Overview tab of the Network Health Report
displays information about the test configuration that was used while creating the
test. The Execution section displays information about the average ping time in ms,
upload and download speeds in Mbps, and percentage of APs within that zone that
passed the test criteria. In this report, only 3 out of the 16 APs passed the test,
therefore the % of APs which
Passed is displayed as 18.75%. Additionally, a small capsule is displayed
next to these values which displays the values derived by comparing current values
with the results from the previous test. If the values improved compared to previous
test results, the capsule is displayed green and colored red if current values were
lower than the previous one. For example, in this report, we can interpret that the
average ping time has reduced by 1.75ms when compared to the previous result.
Therefore, the capsule is colored green.Network Health Report:
Overview TabTotal Score displays the
total number of APs being tested and their status. Following statuses are
displayed:
Success (green)
Failure (red)
Error (orange)
Note: Test success is achieved
only when the AP passes all the tests for each connection tests such as 802.11
Authentication, Association, PSK, DHCP, DNS, and Ping.
For example, in
this report, only 3 out of 16 APs in the zone passed the test, no APs failed and 4
APs showed errors. An error is usually displayed when the test cannot be performed,
for example, when an AP is unavailable or unresponsive.
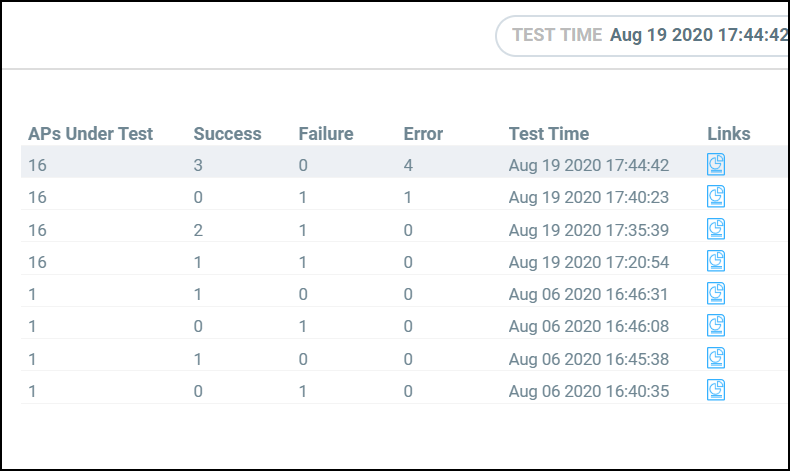
The Test Time field on the
top-right corner of the page displays a log of all the previous tests that were
executed with details about the test status and a links to the test reports.Test Time Log
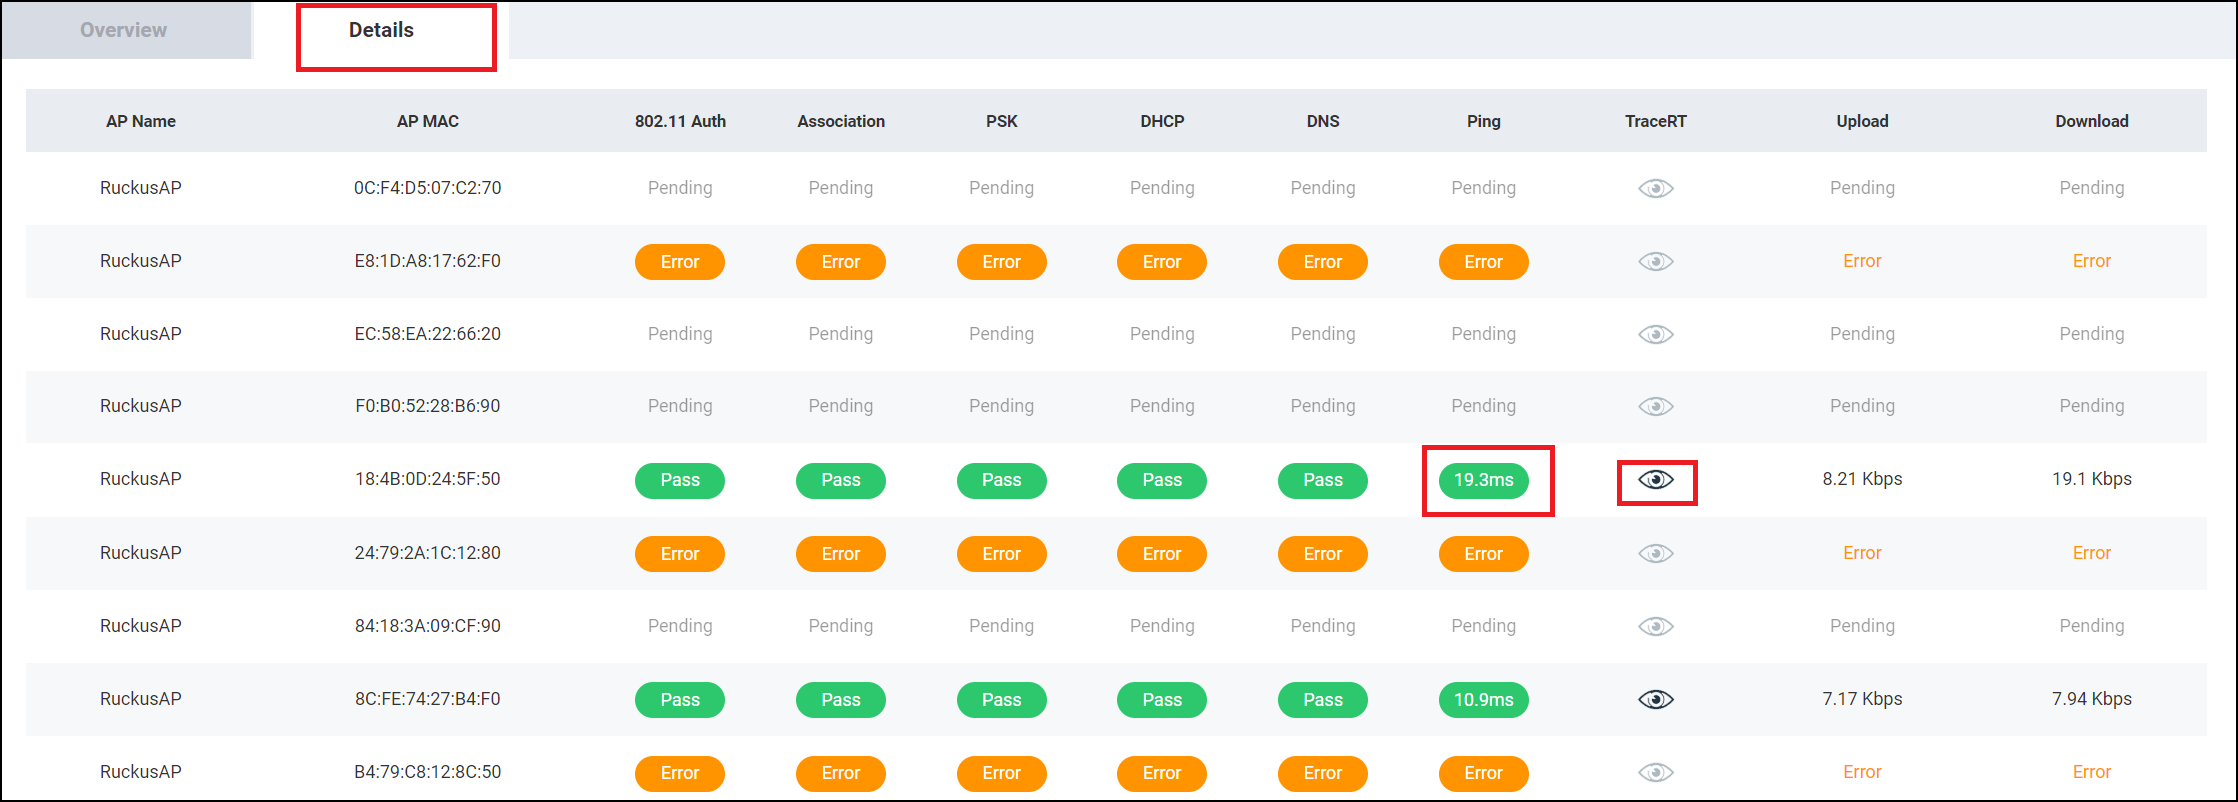
Details Tab
The Details tab of the Network Health Report
displays detailed information about the status of the authentication stages. Network Health Report:
Details TabThe Details Tab of the
Network Health Report
displays the following:
AP Name: Displays the name of
the AP
AP MAC: Displays the MAC
address of the AP
802.11 Auth: Displays that
status of the 802.11 authentication test
Note: For all tests, the status
includes Pass, Fail, Error, and Pending. You can pause the pointer over
the test status capsule to know more about the reason for success,
failure, or error.
Association: Displays that
status of the Association authentication test
PSK: Displays that status of
the PSK authentication test
DHCP: Displays that status of
the DHCP authentication test
DNS: Displays that status of
the DNS authentication test
Ping: Displays that status of
the Ping authentication test. The time taken for the ping response is also
recorded in ms in the capsule.
Traceroute: Displays the
traceroute details such as number of network hops, time taken between hops
for successful ping operations. Pause the pointer over the tarceroute icon
() for more information. It is enabled only when
all authentication stages are passed successfully.
Upload: Displays the upload
speed of the network. Timeout is displayed if the speed test times out for some
reason.
Download: Displays the
download speed of the network. Timeout is displayed
if the speed test times out for some reason.
 ) for more information. It is enabled only when
all authentication stages are passed successfully.
) for more information. It is enabled only when
all authentication stages are passed successfully.