Brand 360 Overview
RUCKUS Analytics introduces a new data-sharing model that facilitates data analytics service for franchise business models related to hospitality sector. The key stakeholders in this model, brands and partners, are bound by a service-level agreement (SLA) that sets the benchmark for the service quality and operations management of the network that is expected to be delivered by the partners.
Brand 360 provides an isolated environment for the brands to view network data of multiple partners collected from network infrastructures deployed across different properties. Brand 360 enables the brands to set SLA thresholds for certain metrics and helps them gain quick insight into the network health and service quality of the properties managed by their partners.
RUCKUS Analytics provides several valuable resources for the brands:
- Dashboard: Provides exclusive access to partner network data that summarizes their SLA compliance level against key metrics.
- Data Studio: Extends intuitive reporting functionality support.
- Labels: Helps to organize and monitor partners and properties.
Brand Invitation
A user can be invited to have the role of a Brand to access and monitor partner's network data. The user who sends the brand invitation is considered the partner and the user who accepts the invitation is considered the brand. When the brand invitation is sent to a user who does not belong to the partner's organization, the partner is explicitly granting the Brand role access to its RUCKUS Analytics service account to the invitee. In addition, depending on the assigned role, the invitee gains access to the partner's account with Admin or Network Admin privileges. If the Admin role is granted, the brand will also be able to invite other users into the partner's account. If this is not desired, make sure to assign the Network Admin role.
- Only the users who have Admin privileges can send a brand invitation.
- The invitees must have a valid email address registered with RUCKUS Support and have access to their own RUCKUS Analytics service account.
- The invitee cannot have preexisting access to the RUCKUS Analytics service account of the user sending the invitation. The invitee's user account must be removed before sending the brand invitation.
Complete the following steps to invite a user as a brand.
- From the web interface, go to .
User Management 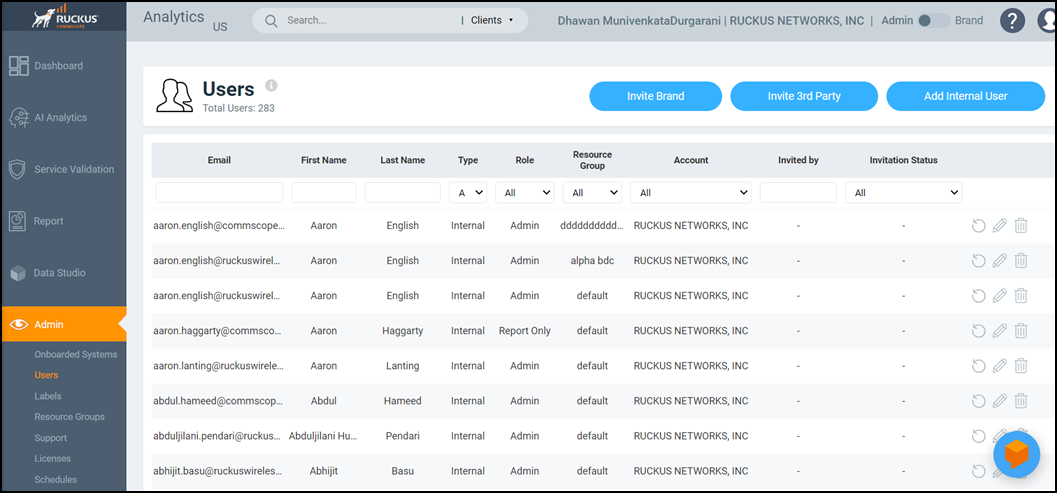
- Click Invite
Brand. The Invite Brand dialog box is displayed.
Searching by Email ID 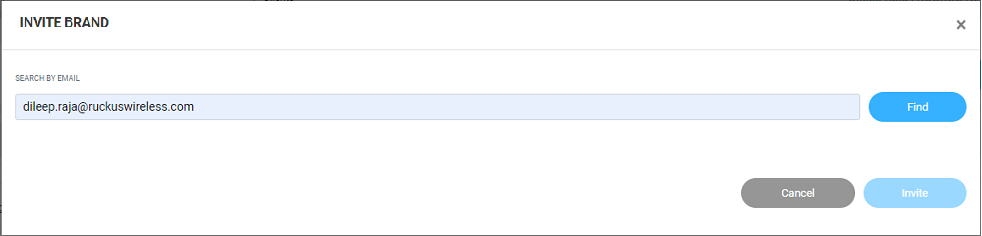
- Enter the email address of the user and click Find to search
for the user by email ID.
The Invite Brand dialog box expands to display other required fields.
Invite Brand Dialog Box 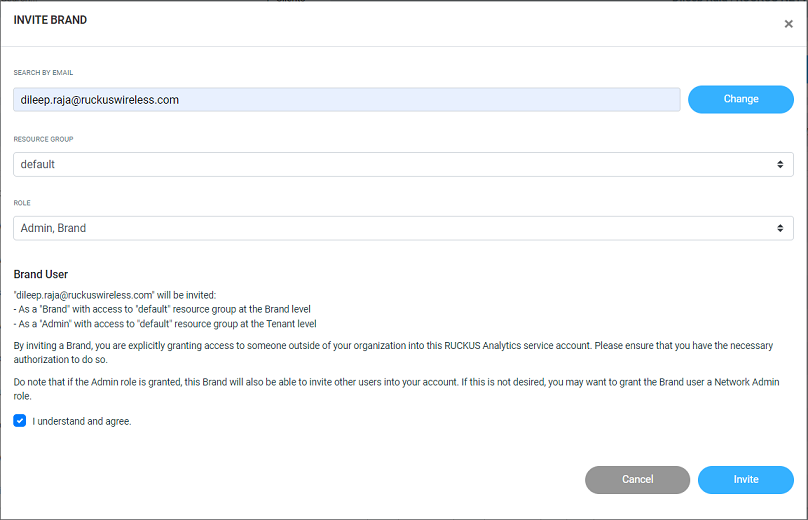
- Select a resource group from the Resource Group list to assign a resource group to which the invitee will have access at the brand level. For more information, refer to Managing Resource Groups.
- Select one of the following roles to assign to the user from the
Role list:
- Admin, Brand: The invitee will have the Brand role at the barnd level and the Admin role at the partner level.
- Network Admin, Brand: The invitee will have the Brand role at the barnd level and the Network Admin role at the partner level.
- Select the I
understand and agree check box and click Invite.
Information relevant to the invitee is displayed on the Users page. The invitee may accept or reject the invitation; the status of which is also displayed on this page as Accepted, Rejected, or Pending.
An automated email notification with all the invitation details and an access link to RUCKUS Analytics is sent to the specified email address of the invitee. Simultaneously, the brand invitation details are displayed on the Accounts page of the invitee's RUCKUS Analytics service account.
Accepting the Brand Invitation
- Log in to the RUCKUS Analytics account.
- Go to . The Accounts page displays the brand invitation details.
Accounts Page: Brand Invitation Notification Details 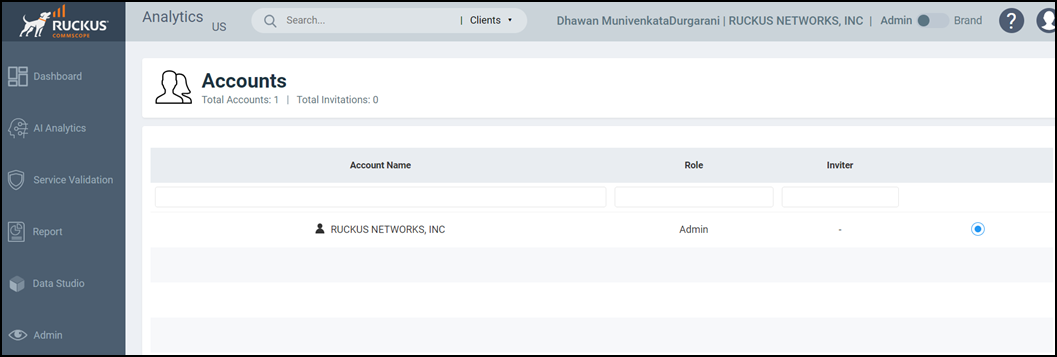
- Click Accept. A rejected invitation is removed from the account immediately. After an invitation is accepted, a new toggle button is displayed which allows the invitee to switch between the Admin and Brand modes. For more information, refer to Brand 360 Dashboard.Note: The toggle button is displayed only under the user's organization service account.
Admin and Brand Mode Toggle Button 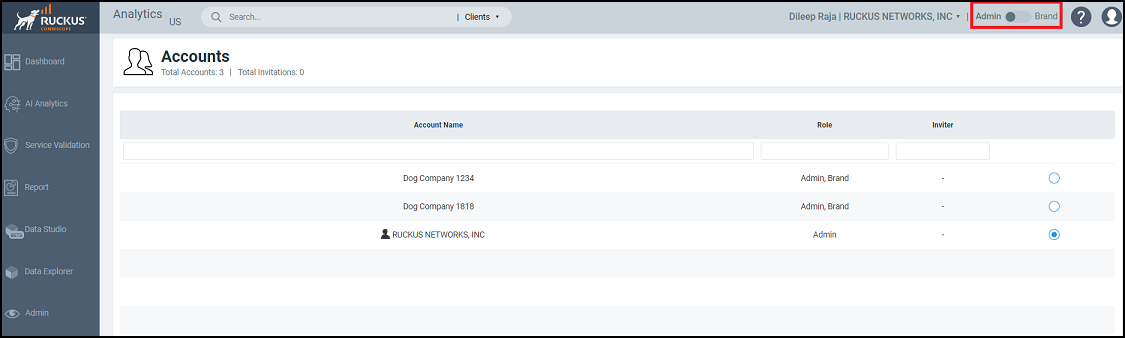
Brand 360 Dashboard
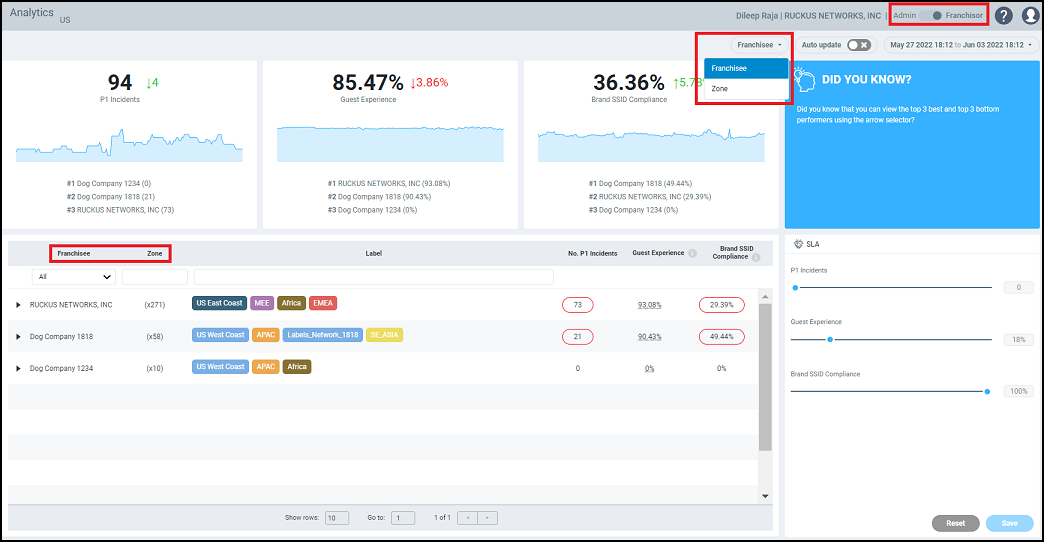
The Brand 360 dashboard provides an overview of the associated partners and summarizes the data of the operations management and service quality of the property managed by the partners. The dashboard provides a centralized monitoring window exclusively for the brand to track the aggregate network data of the partners and assess their performance against some key metrics and compliance with service-level agreements (SLAs).
- Brand: Allows a view of the partner's network data for the predefined metrics.
- Admin: Allows a view of the
brand's own RUCKUS Analytics
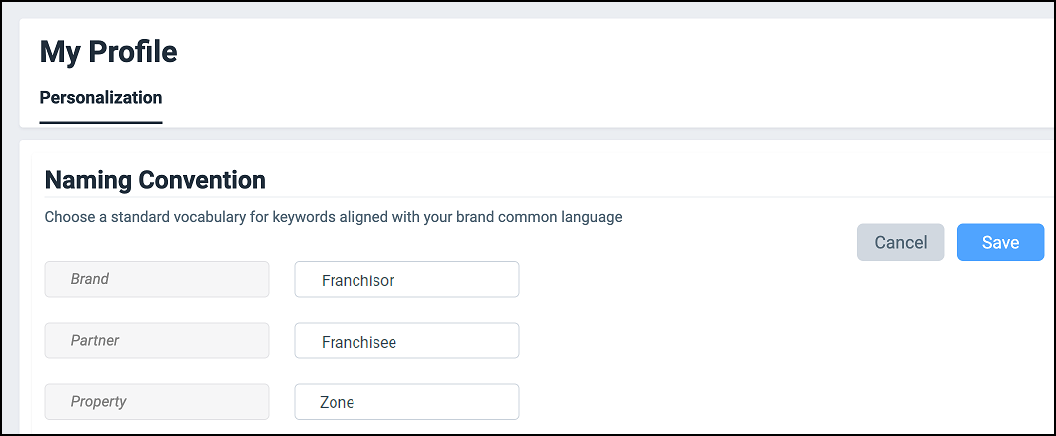
service account.Note: The terms brand and partner as used in this guide have different meanings in different contexts, and denote roles, modes, and view types at the User Admin level. The brand can customize the UI display names for these attributes in the My Profile settings page, where standard vocabulary that aligns with the company's common business glossary can be added. For more information, refer to Naming Convention.
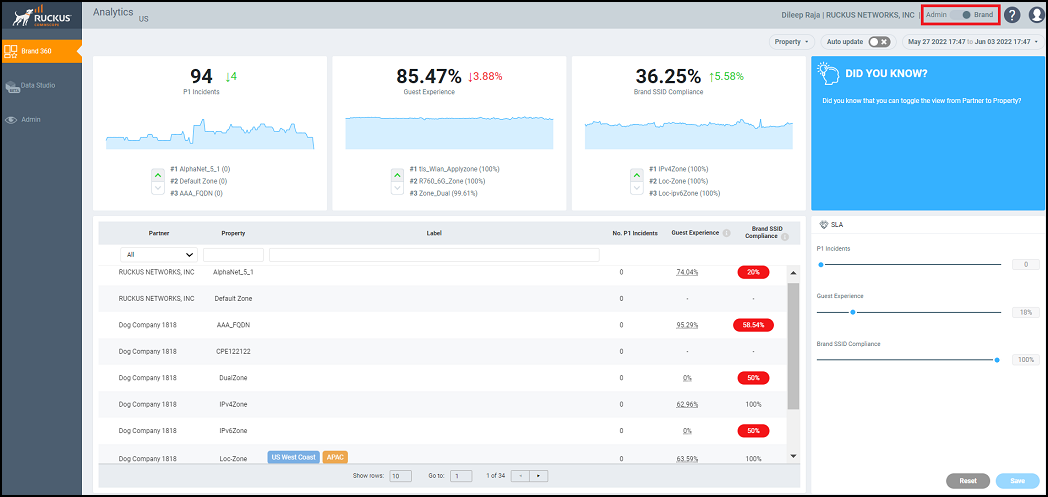
- P1 Incidents: Displays the total number of high-severity incidents that have occurred in the network across all the partners.
- Guest Experience: Displays the average percentage of guest experience across all partners. The guest experience score is determined by calculating the average percentage of three metrics: Time to Connect, Connection Success, and Client Throughput.
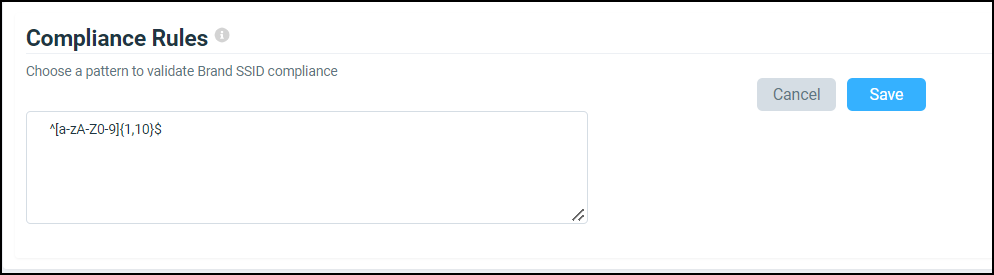
- Brand SSID Compliance: Displays the percentage of the network properties that conforms to the SSID compliance rules set in the My Profile settings.
- Delta counter: Displays the difference in value compared to the previous time period indicating positive or negative change with respect to the metrics.
- Time series graph: Displays the value of respective metrics over time. Pausing the pointer over the time series graph at a particular point displays the value at that time and date.
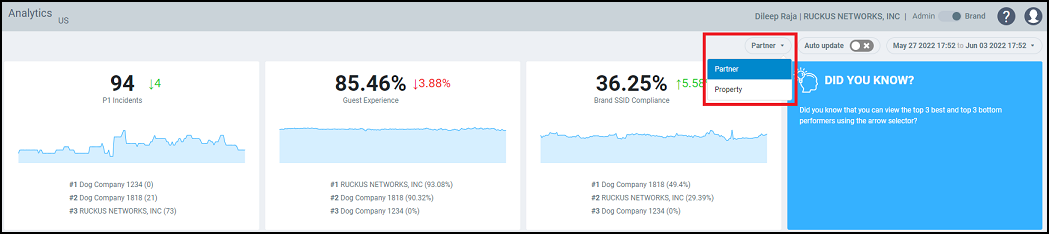
- Selector arrow: The top three best performing and three underperforming partners or properties with respect to each metric are displayed. The selector arrow can be used to toggle the view to display the three best performers and the three underperformers. The selector arrow is available only if there are more than three partners or properties.
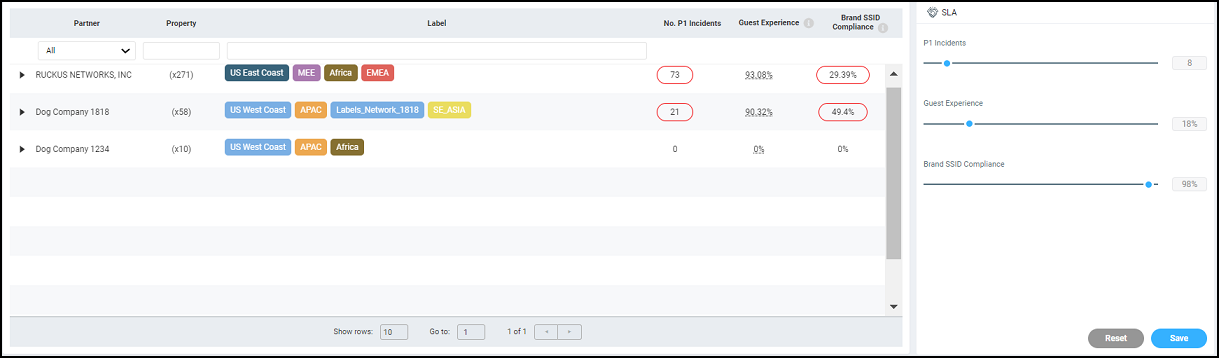
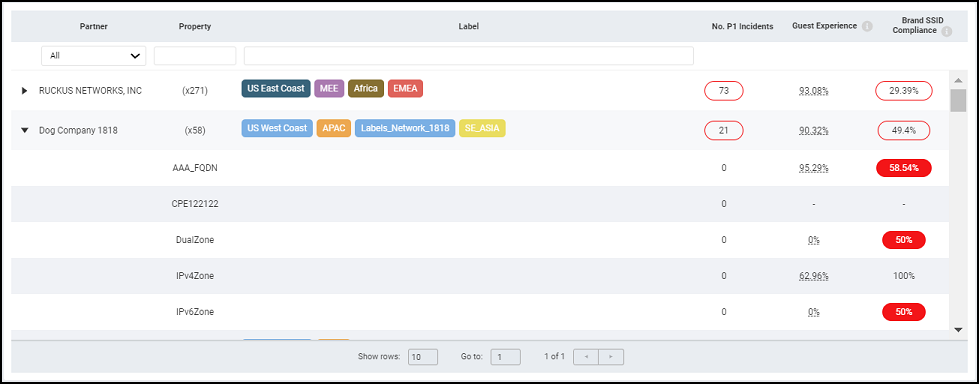
- Partner: Displays the high-level data of each partner associated with the brand. You must expand each partner to view the details of each property.
- Property: Displays the data of each partner at a granular level showing the data of each property.
| Header Field | Description | Additional Information |
|---|---|---|
| Partner | Displays the name of the account that is associated with the brand account as a partner. | |
| Property | Displays the properties managed by the partners. | If the Partner view type is selected from the menu in the top-right of the dashboard, the total number of properties managed by each partner is displayed. |
| Label | Displays the color-coded labels attached to the partners and properties. | The color-coded labels help the brand to identify the properties managed by different partners spreading across different locations, sites, geographical regions, or networks. For more information, refer to Labels. |
| No. P1 Incidents | Displays the number of high-severity incidents that have occurred in the network. | The following design elements indicate SLA
compliance status:
|
| Guest Experience | Displays the average percentage of guest experience of each partner and property. | |
| Brand SSID Compliance | Displays the percentage of the network properties that conforms to the SSID compliance rules. |
Naming Convention