Video Call QoE Test Report
You can collect video call metrics from the test report and analyze them to improve call quality. Quality metrics such as jitter, latency, packet loss, and video frame rate are displayed in addition to call details. This information is displayed for both participants in the call.
- On the Navigation bar, click . The Video Call QoE page is displayed.
- Click Test Call Name attribute. The Video Call QoE Test Report page is displayed.
The Video Call Report contains the following components:
- Participants Details table
- Zoom Call Statistics tile
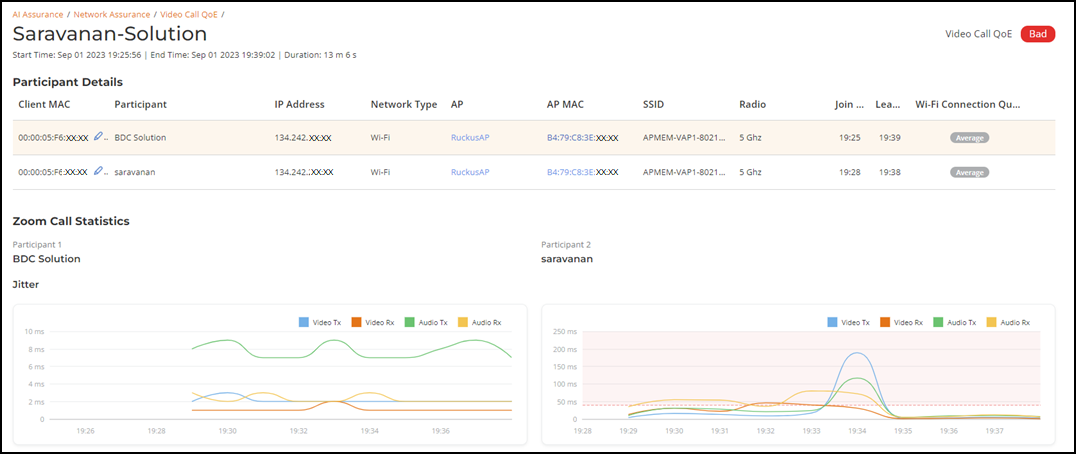
Participants Details Table
The Participants Details
table displays exhaustive information about the call, such as the client MAC
address, participant name, IP address, network type, AP name, AP MAC address, SSID,
radio frequency, join time, leave time, and Wi-Fi connection quality. You can select
the MAC address of the client for the participants by clicking the  icon
in the Client MAC column and select the client for each
participant to view the Wi-Fi statistics. You can also pause the pointer over the
status capsule in the Wi-Fi
Connection Quality column for more information about RSS, SNR, throughput
estimate, and average MCS (downlink). A video call of good quality is displayed as a
green capsule with text "Good" in the Wi-Fi Connection Quality
column, a poor quality call is displayed as a red capsule with text "Bad", and an
average quality call is displayed as a gray capsule with text "Average".
icon
in the Client MAC column and select the client for each
participant to view the Wi-Fi statistics. You can also pause the pointer over the
status capsule in the Wi-Fi
Connection Quality column for more information about RSS, SNR, throughput
estimate, and average MCS (downlink). A video call of good quality is displayed as a
green capsule with text "Good" in the Wi-Fi Connection Quality
column, a poor quality call is displayed as a red capsule with text "Bad", and an
average quality call is displayed as a gray capsule with text "Average".
To view the troubleshooting information, click AP MAC attribute. The Client Troubleshooting Page is displayed. For more information , refer to Client Troubleshooting page.
To view the AP details report, Click AP attribute. The AP Details Report page is displayed. For more information , refer to AP Insights.
Zoom Call Statistics Tile
- Jitter:
Displays jitters produced during the call in milliseconds (ms) for both
participants for the duration of the call. The participant with lower jitter
values experienced better call quality.
Jitter Time-series Graph 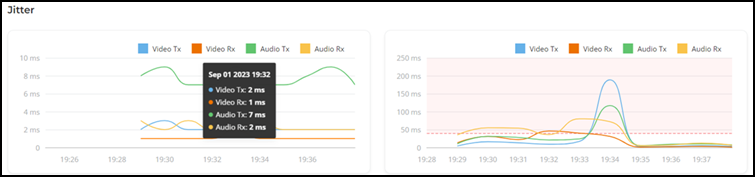
- Latency:
Displays latency (delay) produced during the call in milliseconds (ms) for
both participants for the duration of the call. The participant with lower
latency values experienced better call quality because there was minimum or
no delay in audio and video transmission.
Latency Time-series Graph 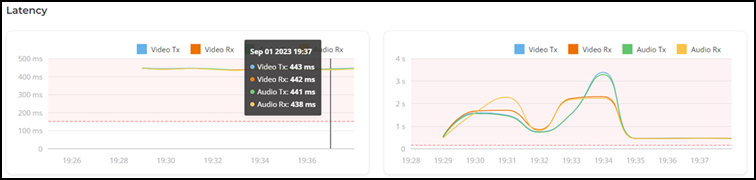
- Packet
Loss: Displays the percentage of data packets lost during
video and audio transmission for both participants. The participant with
lower values experienced better call quality because there was minimum or no
data loss during audio and video transmission.
Packet Loss Time-series Graph 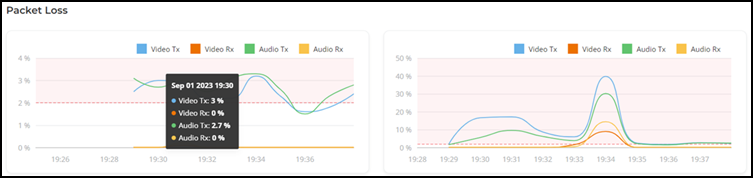
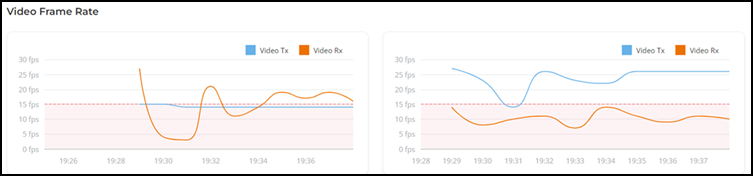
- Video Frame
Rate: Displays the number of video frames transmitted and
received between both participants during the call. If the video call was
successful for both participants, these values will be the same. The
participant with lower frames per second experiences poor video quality.
Video Frame Rate Time-series Graph