Occupancy
The Occupancy page provides insights into space utilization within a facility, such as the most heavily used area or the predominantly least-used area within the facility.
On the Navigation bar, click . The Occupancy page is displayed. To create a site, refer to Creating a Site section.
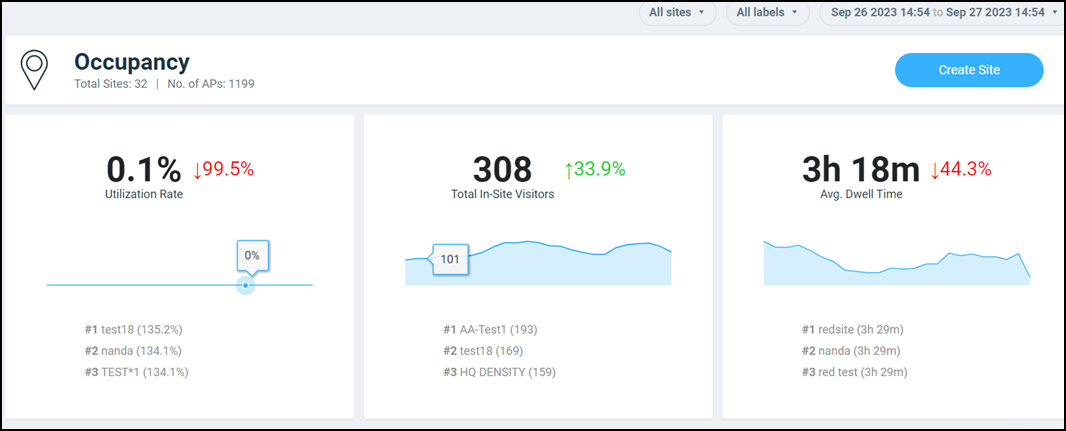
- Header tile
- Utilization tile
- Total In-Site Visitors tile
- Average Dwell Time tile
- Sites Overview tile
- Sites Listing table
The Date and Time filter is displayed in the upper-right corner of the Content panel. This option controls the elements displayed within the Content Panel. To modify this option, refer to Content Panel.
The All sites and All labels filters are displayed in the upper-right corner of the Content panel. These option controls the elements displayed within the Content Panel. Click on the filter, select a value, and click Apply. The applied filter value is displayed in the Content Panel.
Header Tile

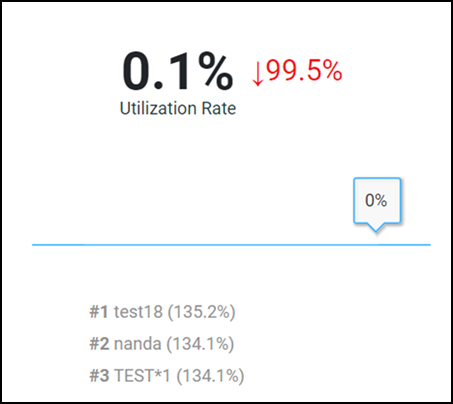
Utilization Rate Tile
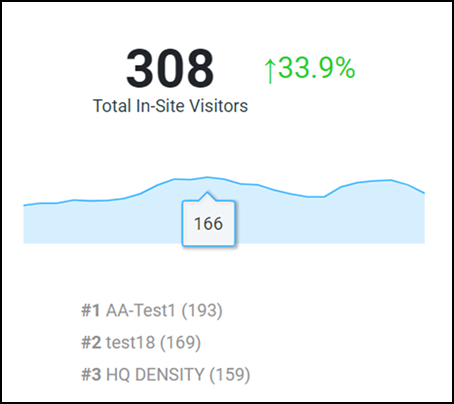
Total In-Site Visitors Tile
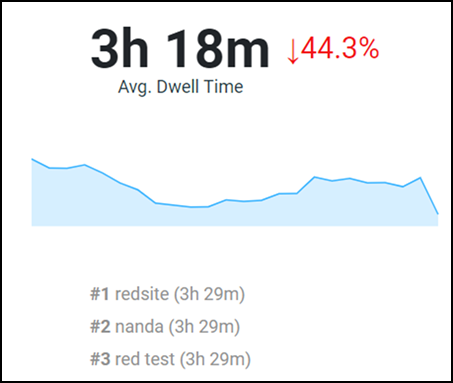
Average Dwell Time Tile
Sites Overview Tile

Sites Listing Table
 icon.
Click the
  icon to view the Site Report. For
more information, refer to Site Report. Click the
  icon
to delete the site. To view the email ID assigned for the notification, hover over
the
  icon. You can select the number of sites displayed in the table from the
Show rows drop down at the bottom of the table. The range
is from five sites per table to 200 sites per table.
Creating a Site
- On the Navigation bar, click . The Occupancy page is displayed.
- Click Create Site.
The Create Site dialog box is displayed.
Create Site Dialog Box 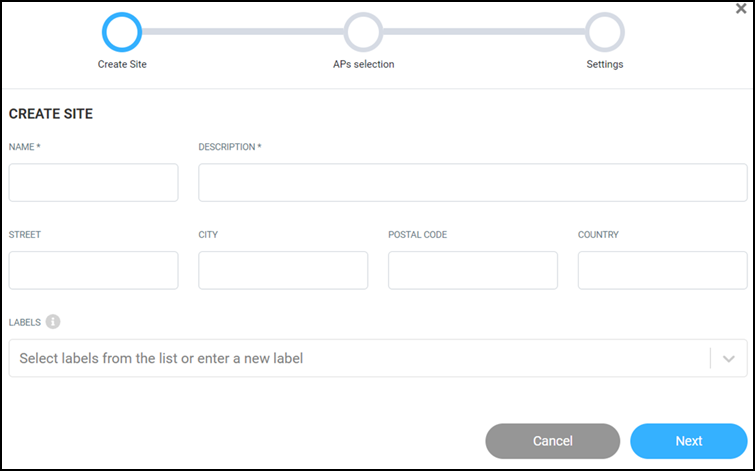
- Complete the following
fields:
- Name: Enter the name of the site.
- Description: Enter the description of the site, such as an area of the facility for which you are creating the site, for example, the gym, the lobby, the third floor, or a similar area.
- Street: Enter the street name where the site is located.
- City: Enter the city name where the site is located.
- Postal Code: Enter the postal code of the site.
- Country: Enter the country name where the site is located.
- Labels: Select a label from the drop down
or you can enter a custom name to create a new label term.Note: You can include one or more labels for a site. Labels make searching for a particular site easy, especially when there are multiple sites within the network.
- Click Next. The
APs selection dialog box is displayed. All the
AP Groups are displayed in the
Network tab.
APs Selection Dialog Box 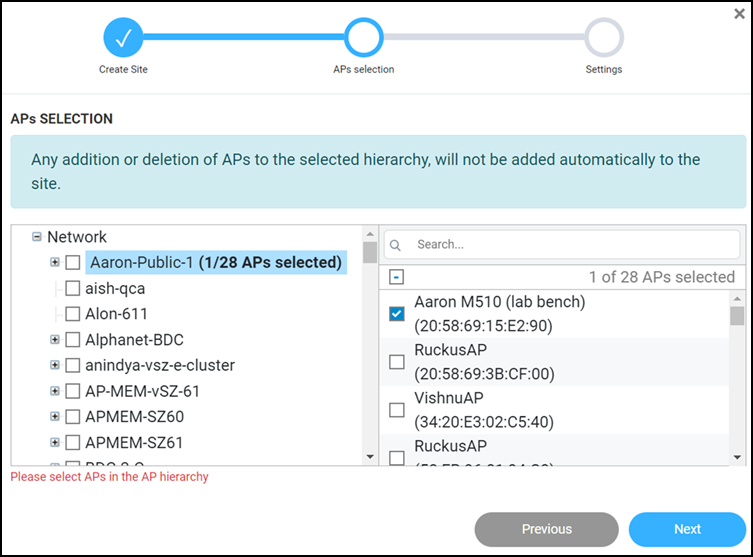
- Click on a AP Group name. All the associated APs of that group are displayed in the right tab.
- In the right tab, select the APs you want to group within this site, or you can search for the required AP using the search field. To select all the APs, select the top-most check box.
- To select the different APs from different AP groups, repeat Step5 and Step6.
- Click Next. The
Settings dialog box is displayed.
Settings Dialog Box 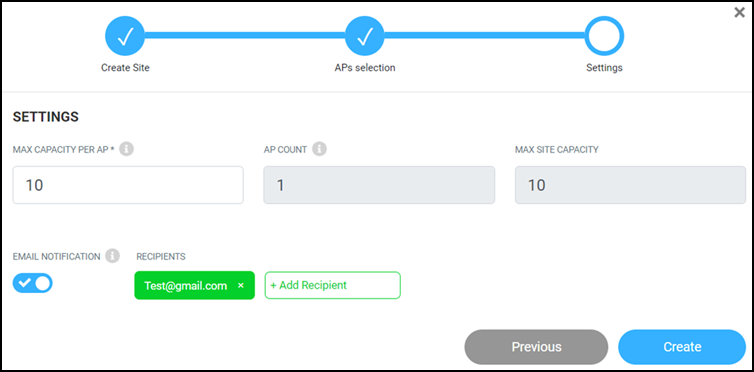
- In the Settings
dialog box, complete the following fields:
- Max Capacity Per AP: Set the maximum number of client devices that can be connected to each AP.
- AP Count: The count of selected APs is displayed.
- Max Site Capacity: The product of Max Capacity Per AP and AP Count is displayed. The value displayed here is the maximum capacity of this site.
- Email
Notification: By default, email notification is
disabled. Toggle the switch to on to enable
email notification. By default, your registered email ID is
displayed in the Recipients field. To add more
recipients, enter the email ID in the
+Recipient field.Note: The email notification is sent every 15 minutes once the site maximum capacity is reached.
- Click Create. The site is created and displayed in the Sites Listing table.