Client Troubleshooting Page
The client troubleshooting page provides you details about the connectivity of a particular client.
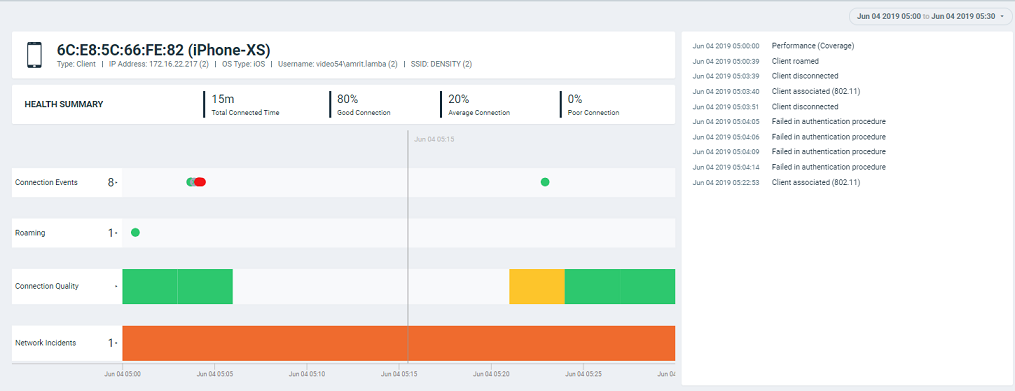
The header displays the MAC address of the client followed by its host name. The line underneath the header lists the following client attributes:
- MAC address
- Last IP address
- Host name
- OS type
- Username
For data fields in which there are multiple entries (such as IP address), the system shows a value in parentheses (for example, (2)). Pausing the pointer on this number shows the additional values for the field.
The Health Summary shows the total time during which the client was connected to the network. The Health Summary highlights the following measurements::
- Total Connected Time
- Percentage of Good Connection
- Percentage of Average Connection
- Percentage of Poor Connection
The health classification (good, average, and poor) depends on the Connection Quality metrics, which consist of SNR, MCS, and Client Capacity metrics.
The Connection Events shows the connection status of the client on the particular WLAN for a specific AP. The connection events are classified (success, failure, slow, and disconnect), and are identified with the following colors:
- Green: Successful connection
- Red circle with exclamation point: Failed connection. You can also click the red circle to view the time of the failure scenario (for example, whether the failure occurred during the EAP request, DHCP discovery, and so on). Pausing the pointer over the circle provides a quick snapshot of information such as the exact time of failure, the type of failure, the client IP address, and so on. The failed path is denoted by a red arrow, as shown in the figure. The figure depicts a failure to send EAP requests to the client.
Failure to Send EAP Request 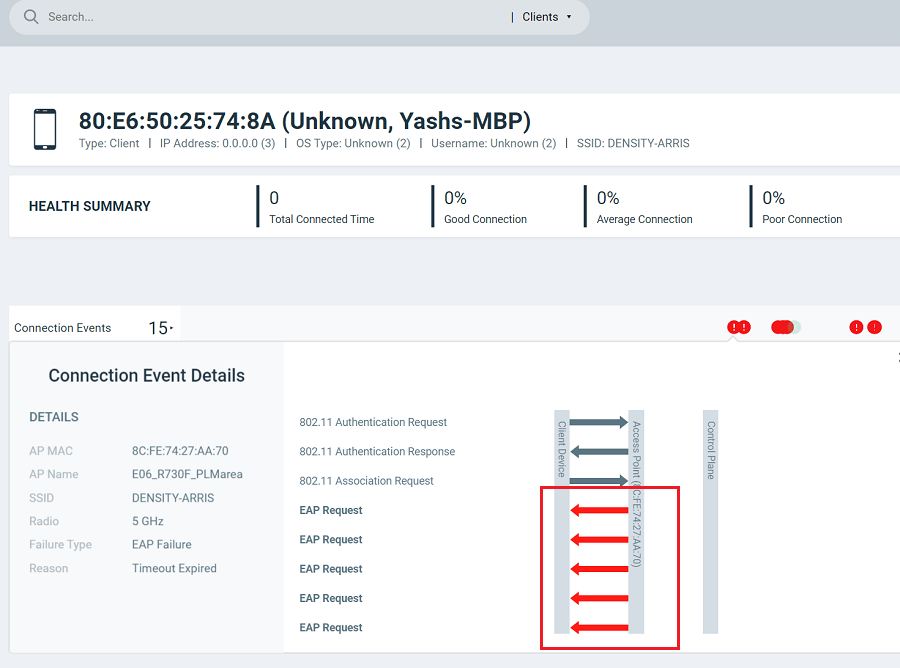
- Yellow: Slow (long time to connect to connection)
- Gray: Disconnected
Roaming shows the connection status when the client either moves to a different WLAN or a different AP. A roaming event is identified with the following colors:
- Green: Successful roam
- Red circle with exclamation point: Failed connection
The Connection Quality shows the quality of the service the client experiences throughout of the network. The connection quality is identified with the following colors:
- Green: Good
- Red: Poor
- Yellow: Average
Network Incidents shows any incidents that affected the client. The incidents are classified (client connection, performance, and infrastructure), and are identified with the following colors and severities:.
- Red: P1
- Dark Orange: P2
- Orange: P3
- Yellow: P4
Based on the client access permissions set in the resource group, the client is only able to view the data for APs for which access permission are granted. If the client roams to an AP for which access permissions are not granted, the AP data is not available to view even though the connection between client and AP (roamed to) are established.