The
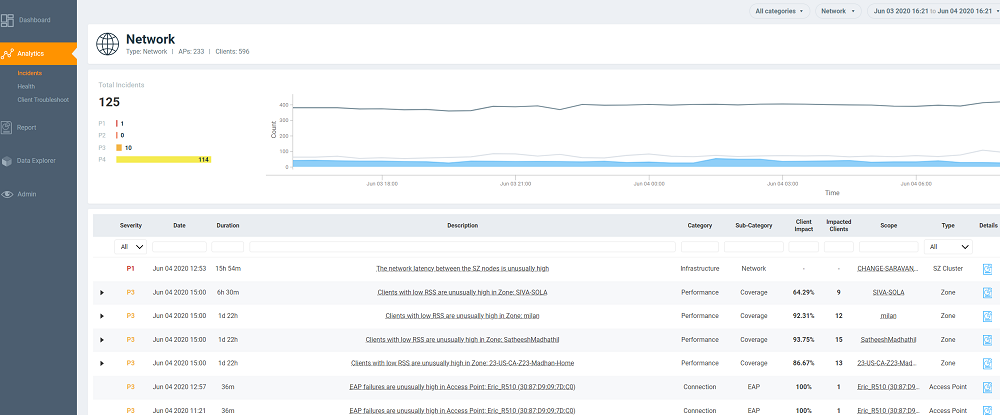
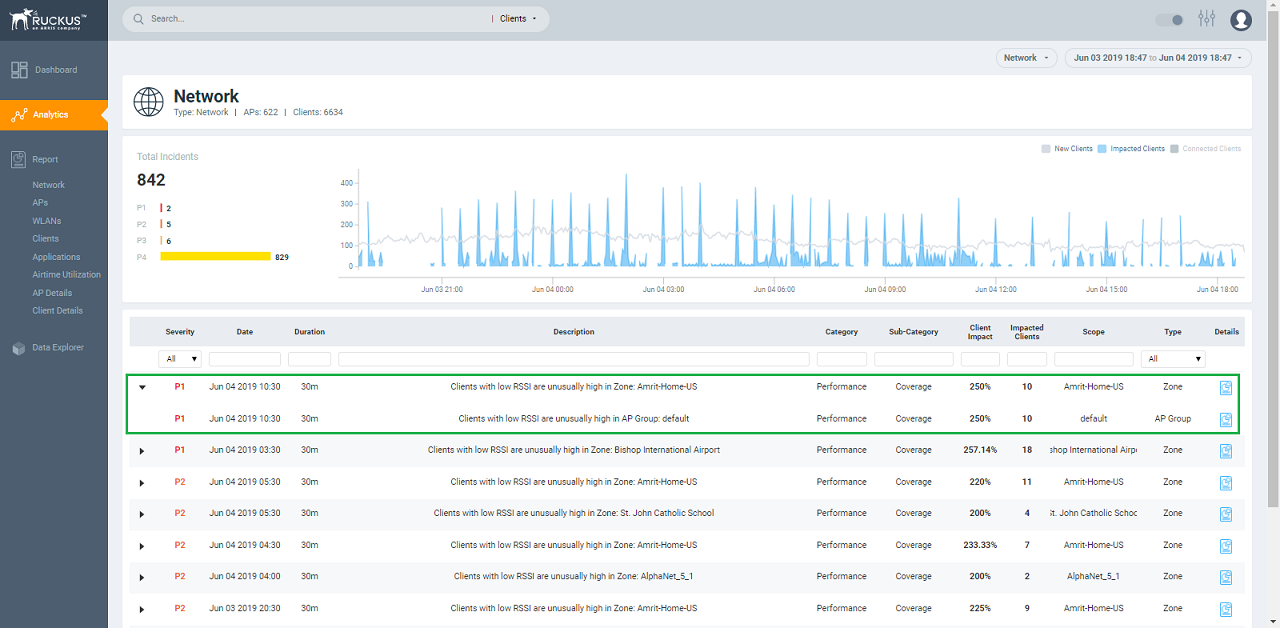
Analytics page provides a breakdown of incidents by severity and category, allowing you to focus on incidents of interest, for which they can view details. For any given incident, you can view the severity, client impact, root cause, and recommendations, as well as the events, anomalies, data, or problems that were used to identify the incident.
Analytics Page
The analytics page consists of different sections which are described as follows:
The Analytics page contains a number of components:
Network Filter menu
Date and Time filter
Network Node Details tile
Severity Filter tile
Incident Timeline
Incident List table
Incident Details
Network Impact tile
Insights
Incident Info tile
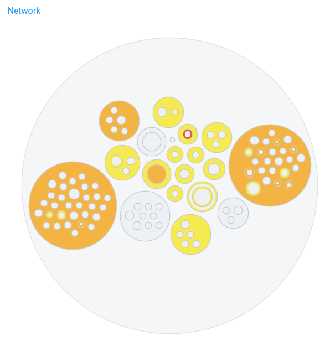
Network Filter Menu
Nodes on the Network
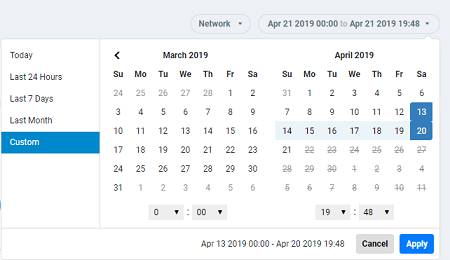
Date and Time Filter
The date and time filter is used to plot the date and time for a specific time period, including such as
Today,
Last 24 hours,
Last 7 days, or
Last Month.Use the Custom option to select the dates and times for a specific customized time period.
Custom Mode
Click
Apply to save the specified date and time filters and update the Analytics page.
Network Node Details
The Network Node Details tile displays the name of the selected node from the
Network Filter menu as a header.
For example, the following figure shows the Density network node and its attributes (Type, APs, and Clients).
The following table lists the various network nodes and their attributes.
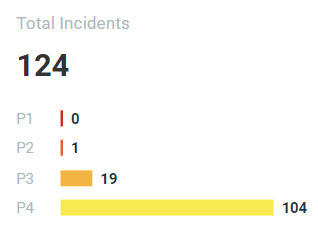
Severity Filter
The severity filter tallies the total number of incidents on the network node, and lists the number of incidents by severity.
Severity Filter
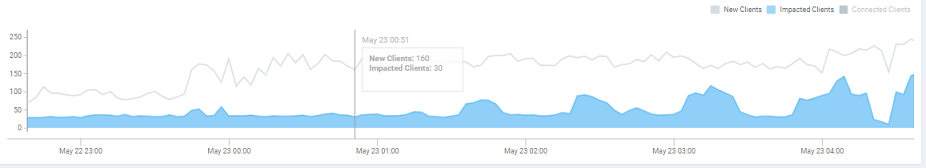
Incident Timeline
The Incident Timberline is a graphical representation of the number of new clients connecting to the network (the light gray line), the number of clients actively connected to the network (the dark gray line) and the number of clients affected by the network incidents (the blue area in the chart).
Incident Timberline
Pausing the pointer at any instance on the timeline displays an information box that shows the number of new clients, impacted clients, and connected clients. You can modify the information displayed in the information box by selecting the
New Clients, Impacted Clients, and
Connected Clients check boxes.
Note: On computers running Windows, press
Ctrl and rotate the wheel button to zoom in and zoom out of the Incident Timeline.
Incidents List Table
The Incidents List table offers a summary of each incident.
Incidents List Table
Each incident is made up of a number of attributes. Under each attribute is a search field to limit the incident list based on the search criteria. Click the right arrow button to view more information about other incidents that contribute to the selected incident and information about the parent incident to which the selected incident contributes.
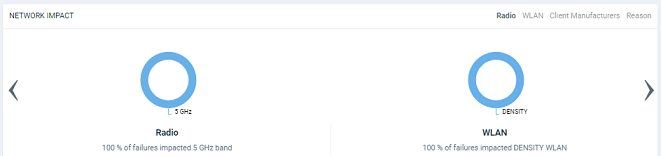
Network Impact Tile
The Network Impact tile consists of various donut charts that represent the areas of the network that were impacted by the incident. Each incident type and subtype has a different set of network impact donut charts, but it is common to see WLANs, Client OS Types, AP Models, Radio Bands, and Reason Codes, which all help to explain some of the common questions: who is impacted, which devices are contributing, what are the reason codes, and more. Every donut chart is divided into donut charts of different colors. If you pause the pointer over any portion of the donut chart, an information box displays the impacted area of the incident and the clients affected by this the incident. Beneath each donut chart is a summary line Two donut charts are shown by default. You can click the right arrow and left arrow to navigate to other donut charts, or click Radio, WLAN, Client Manufacturers, or Reason to access a specific donut chart.
Network Impact Tile
Table 1. Attributes of Network Impact Table
Incident Type
Donut Charts
Chart Elements
User Authentication
Radio: The distribution of impacted clients who connected to 5 GHz and 2.4 GHz radios.
WLAN: The different WLANs to which the impacted clients are connected.
Client Manufactures: The distribution of device manufacturers.
Reason: The breakdown of various failure reasons experienced by the impacted clients.
.
Authentication Failure Ratio: A time series chart that shows the failure ratio over time. The chart includes data for 6 hours before and 6 hours after (if available) the incident.
Clients: Three types of time series data: a line for new clients, a line for connected clients, and an area chart for impacted clients.
Failure counts: A time series chart with three types of raw failure counts: Authentication Failures, Authentication Attempts, and Total Failures, which includes the total of all types of connection failures (authentication, association, EAP, DHCP, and so on) that were observed during this period.
EAP
Radio: The distribution of impacted clients who connected to 5 GHz and 2.4 GHz radios.
WLAN: The different WLANs to which the impacted clients are connected.
Client Manufactures: The distribution of device manufacturers.
Reason: The breakdown of various failure reasons experienced by the impacted clients.
EAP Failure Ratio: A time series chart that shows the failure ratio over time. The chart includes data for 6 hours before and 6 hours after (if available) the incident.
Clients: Three types of time series data: a line for new clients, a line for connected clients, and an area chart for impacted clients.
Failure counts: A time series chart with three types of raw failure counts: EAP Failures, EAP Attempts, and Total Failures, which includes the total of all types of connection failures (authentication, association, EAP, DHCP, and so on) that were observed during this period.
Association
Radio: The distribution of impacted clients who connected to 5 GHz and 2.4 GHz radios.
WLAN: The different WLANs to which the impacted clients are connected.
Client Manufactures: The distribution of device manufacturers.
Reason: The breakdown of various failure reasons experienced by the impacted clients.
Association Failure Ratio: A time series chart that shows the failure ratio over time. The chart includes data for 6 hours before and 6 hours after (if available) the incident.
Clients: Three types of time series data: a line for new clients, a line for connected clients, and an area chart for impacted clients.
Failure counts: A time series chart with three types of raw failure counts: Association Failures, Association Attempts, and Total Failures, which includes the total of all types of connection failures (authentication, association, EAP, DHCP, and so on) that were observed during this period.
DHCP
Radio: The distribution of impacted clients who connected to 5 GHz and 2.4 GHz radios.
WLAN: The different WLANs to which the impacted clients are connected.
Clients Manufactures: The distribution of device manufacturers.
Reason: The breakdown of various failure reasons experienced by the impacted clients.
DHCP Failure Ratio: A time series chart that shows the failure ratio over time. The chart includes data for 6 hours before and 6 hours after (if available) the incident.
Clients: Three types of time series data: a line for new clients, a line for connected clients, and an area chart for impacted clients.
Failure counts: A time series chart with three types of raw failure counts: DHCP Failures, DHCP Attempts, and Total Failures, which includes the total of all types of connection failures (authentication, association, EAP, DHCP, and so on) that were observed during this period.
RADIUS
Radio: The distribution of impacted clients who connected to 5 GHz and 2.4 GHz radios.
WLAN: The different WLANs to which the impacted clients are connected.
Client Manufactures: The distribution of device manufacturers.
Reason: The breakdown of various failure reasons experienced by the impacted clients.
Radius Failure Ratio: A time series chart that shows the failure ratio over time. The chart includes data for 6 hours before and 6 hours after (if available) the incident.
Clients: Three types of time series data: a line for new clients, a line for connected clients, and an area chart for impacted clients.
Failure counts: A time series chart with three types of raw failure counts: RADIUS Failures, RADIUS Attempts, and Total Failures, which includes the total of all types of connection failures (authentication, association, EAP, DHCP, and so on.) that were observed during this period.
Time to Connect
Radio: The distribution of impacted clients who connected to 5 GHz and 2.4 GHz radios.
WLAN: The different WLANs to which the impacted clients are connected.
Client Manufactures: The distribution of device manufacturers.
Reason: The breakdown of various failure reasons experienced by the impacted clients.
Time to Connect Failure Ratio: A time series chart that shows the failure ratio over time. The chart includes data for 6 hours before and 6 hours after (if available) the incident.
EAP Failure Ratio: A time series chart that shows the failure ratio over time. The chart includes data for 6 hours before and 6 hours after (if available) the incident.
Clients: Three types of time series data: a line for new clients, a line for connected clients, and an area chart for impacted clients.
Failure counts: A time series chart with three types of raw failure counts: Time to Connect Failures, Time to Connect Attempts, and Total Failures, which includes the total of all types of connection failures (authentication, association, EAP, DHCP, and so on) that were observed during this period.
RSSI
Radio: The distribution of impacted clients who connected to 5 GHz and 2.4 GHz radios
WLAN: The different WLANs to which the impacted clients are connected.
Client Manufactures: The distribution of device manufacturers.
Reason: The breakdown of various failure reasons experienced by the impacted clients.
RSSI Quality by Clients: Three types of time series data: a line for new clients, a line for connected clients, and an area chart for impacted clients.
RSSI Distribution: The RSSI distribution over a period of time.
Network Latency
Ping Latency: Average time, in milliseconds, for the controller nodes to transmit and receive the packets. Maximum, average, and minimum latency trends are plotted on the graph.
Controller-1: CPU, memory and input-output usage of the controller node over time is displayed.
Controller-2: CPU, memory and input-output usage of the other controller node over time is displayed.
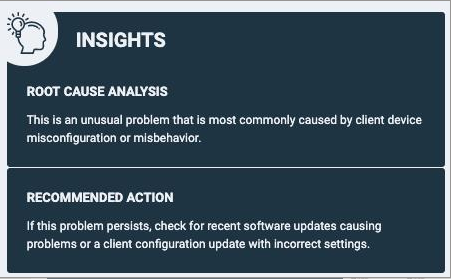
Insights Tile
The Insight tile of the
Incident Details page provides a summary of the root cause and recommended action for the incident. The root cause varies based on the incident type, impacted area, data events, and reason codes.
Insights Tile
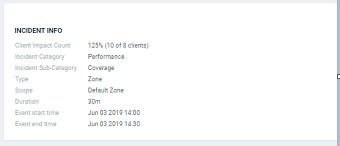
Incident Info Tile
The
Incident Info tile lets you know the client impact count, the category and sub-category of the incident, the type, scope, duration, and date and time of the incident.. To explore more about the impacted clients, click
Client Impact Count.
Incident Info Tile
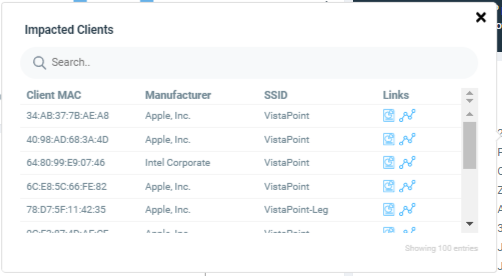
The
Impacted Clients page displays the user name, host name, client MAC address, SSID, and manufacturer of the client. To troubleshoot the client, click the Client Troubleshooting icon (), or to generate the client details report, click the Client Details icon () on the
Impacted Clients page. You can search for impacted clients by the client MAC address and manufacturer.
 ), or to generate the client details report, click the Client Details icon (
 ) on the
Impacted Clients page. You can search for impacted clients by the client MAC address and manufacturer.
) on the
Impacted Clients page. You can search for impacted clients by the client MAC address and manufacturer.