Airtime Utilization Report
The Airtime Utilization Report provides an overview of airtime utilization.
The Airtime Utilization Report lists the APs by airtime utilization for radio 2.4 GHz and 5 GHz. It also lists the airtime utilization trend over time based on APs and radio.
The Airtime Utilization Report consists of the following components:
- Overview tile
- Top 10 APs by Airtime Utilization chart
- Top APs by Airtime Utilization for 2.4 GHz table
- Top APs by Airtime Utilization for 5 GHz table
- Airtime Utilization Trend graphs
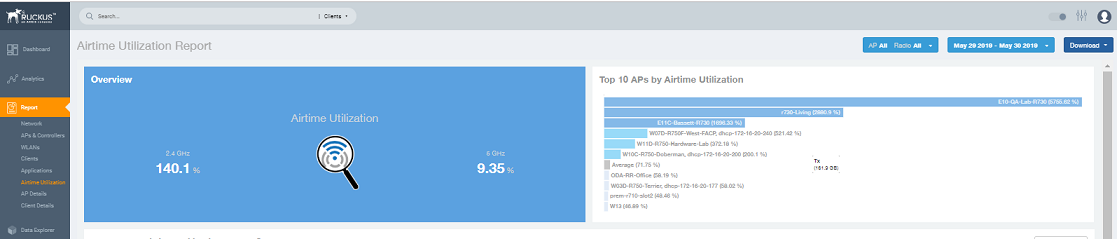
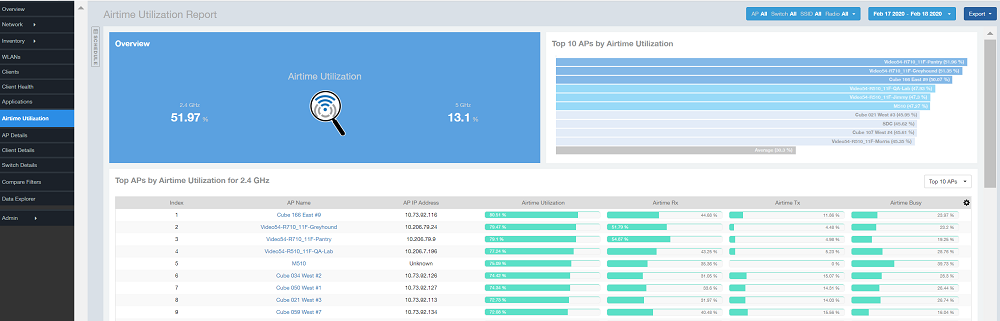
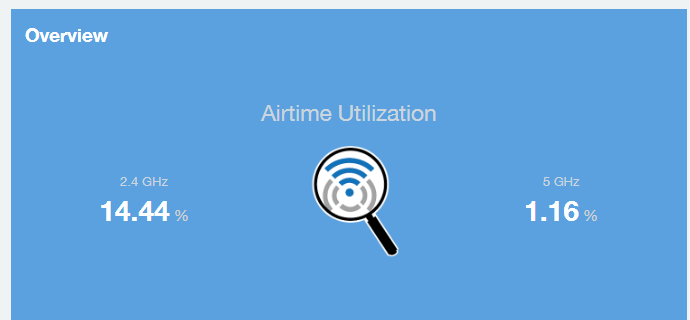
Overview Tile
The Overview tile of the Airtime Utilization Report displays the aggregate utilization rates for all of the 2.4-GHz and 5-GHz radios on all APs for the selected time period.
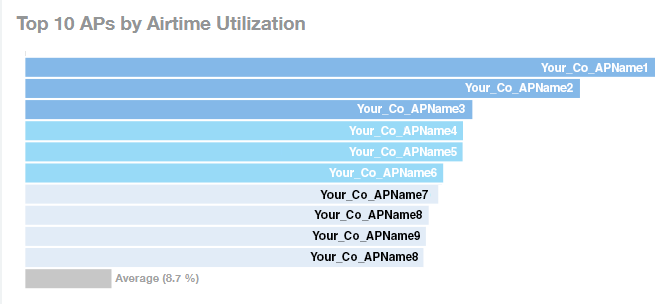
Top 10 APs by Airtime Utilization Chart
Use the Top 10 APs by Airtime Utilization chart to view which APs have the highest airtime utilization percentage rates.
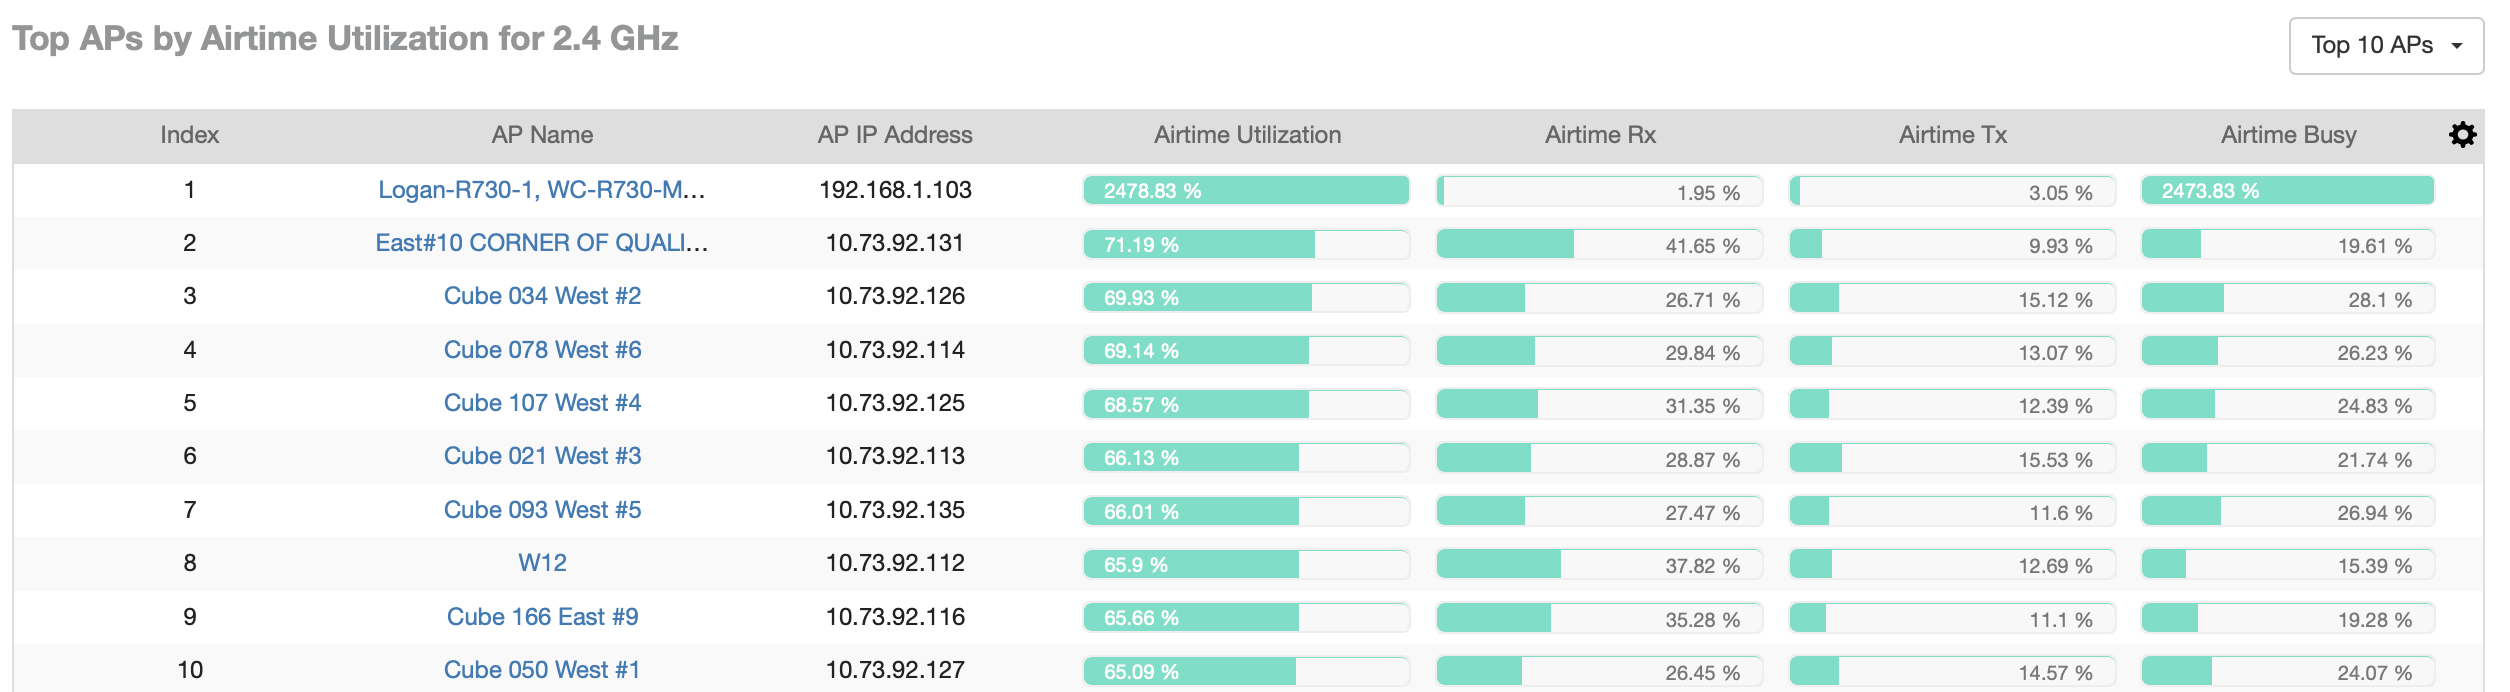
Top APs by Airtime Utilization for 2.4 GHz Table
The Top APs by Airtime Utilization for 2.4 GHz table displays which APs have the highest utilization on the 2.4 GHz radio.
Use this table to view a list the top APs with the highest airtime utilization sorted according to the selected columns. Click the gear icon ( ) to select the columns to display, and click any column heading to sort the table by that column.
You can select the top 10 (default), 20, 50, or 100 APs by airtime utilization to display. The number of rows in a page is defined by the Rows per Page option in the table settings menu.
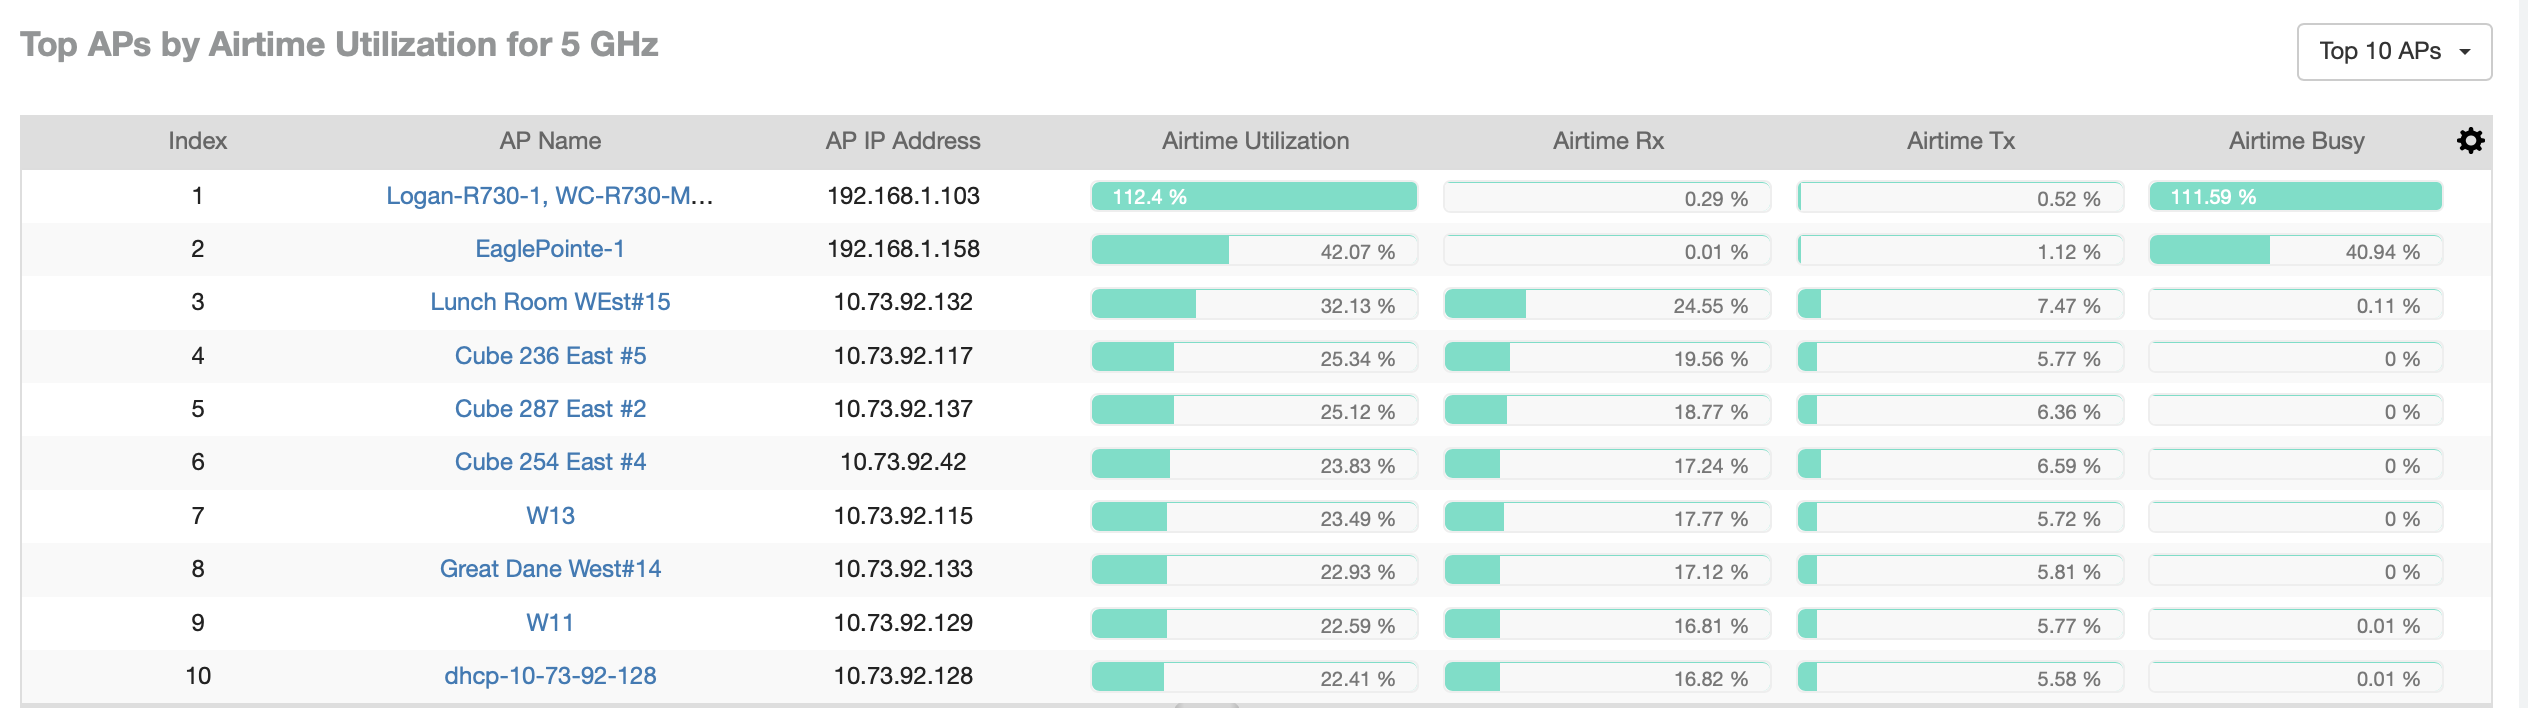
Top APs by Airtime Utilization for 5 GHz Table
The Top APs by Airtime Utilization for 5 GHz table of the Airtime Utilization Report displays which APs have the highest utilization on the 5 GHz radio.
Use this table to view a list of the top APs with the highest airtime utilization sorted by the selected columns. Click the gear icon () to select the columns to display, and click any column heading to sort the table by that column.
You can select the top 10 (default), 20, 50, or 100 APs by airtime utilization to display. The number of rows in a page is defined by the Rows per Page option in the table settings menu.
Airtime Utilization Trend Graph
The Airtime Utilization Trend graph shows the airtime utilization trends for 2.4-GHz and 5-GHz radios in percentages over time.
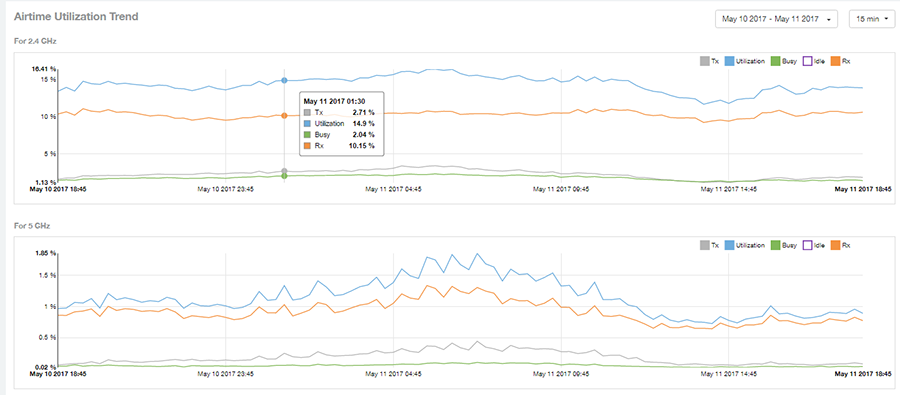
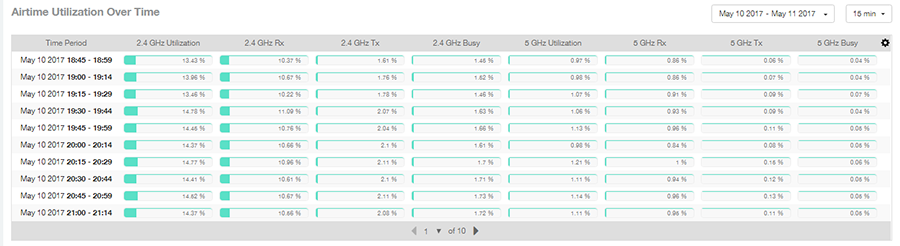
Airtime Utilization Over Time Table
Use the Airtime Utilization Over Time table to compare utilization rates between time periods, and to examine specific airtime utilization data, such as time spent busy or idle, transmitting or receiving,, and user traffic compared management traffic.