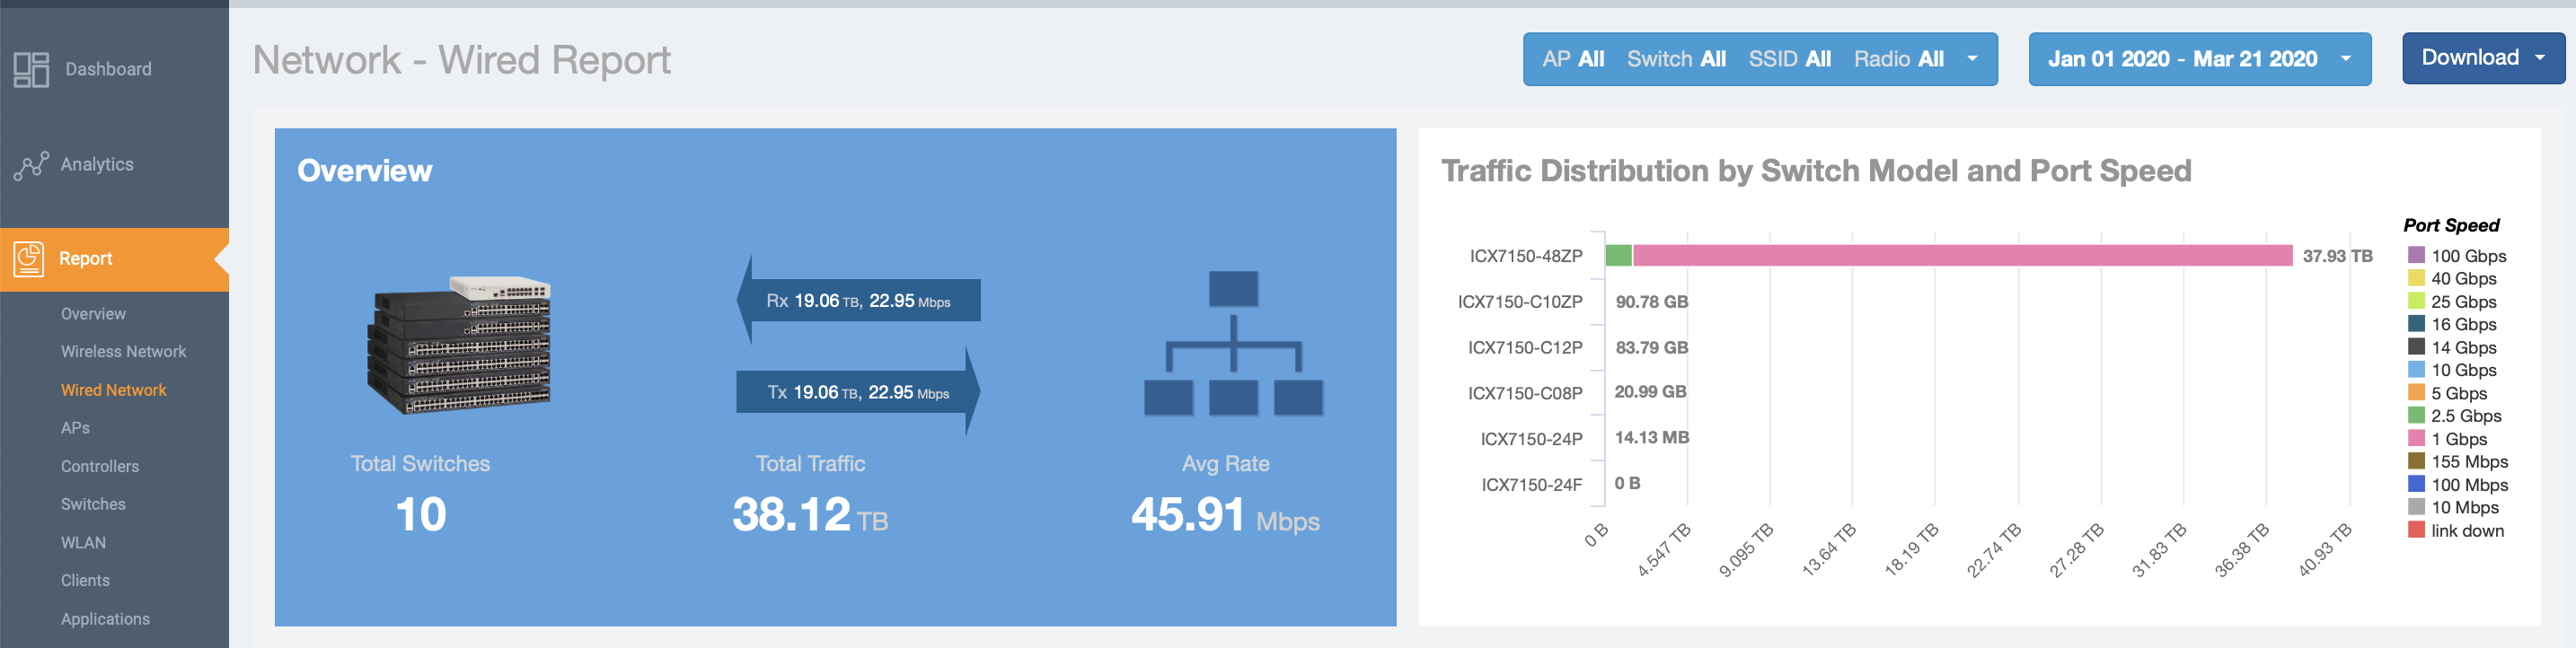
Wired Report
The Network - Wired Report provides details of total traffic, APs and clients on the network. It also contains the received and transmitted traffic between them.
From the navigation bar, select Network > Wired.
- Overview tile
- Traffic Distribution by Switch Model and Port Speed tile
- Top Switches by Traffic tile
- Top Switches by PoE Usage tile
- Top Switches by Errors tile
- Traffic Trend tile
- Error Trend tile
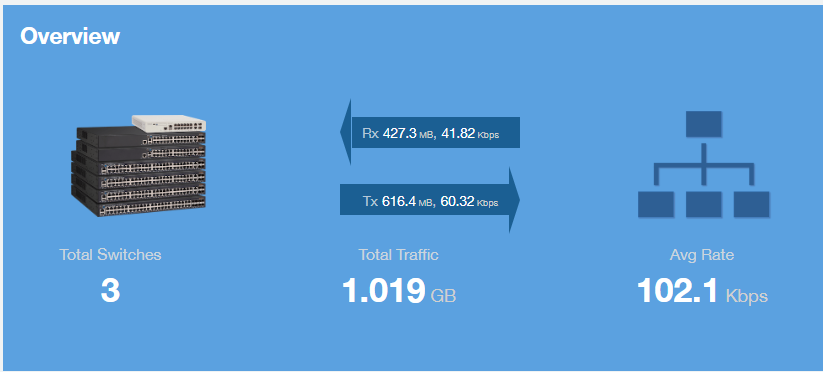
Overview Tile
The Network - Wired Report Overview section provides a general overview of the entire network.
The Overview section displays the following, based on your selection of APs, and switches filters:
- Total traffic and the average traffic rate
- Total traffic received and transmitted and the average traffic rate
- Total number of switches
- Total clients on the network
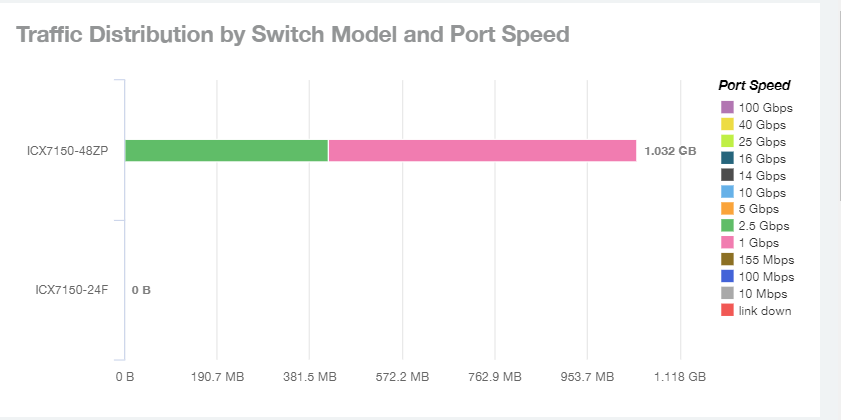
Traffic Distribution by Switch Model and Port Speed Tile
The Traffic Distribution by Switch Model and Port Speed chart of the Network -Wired Report displays the distribution of traffic by port speed for each switch model being used.
Use this chart to display traffic distribution based on your selection of APs, SSID, Radio and Date Range filters.
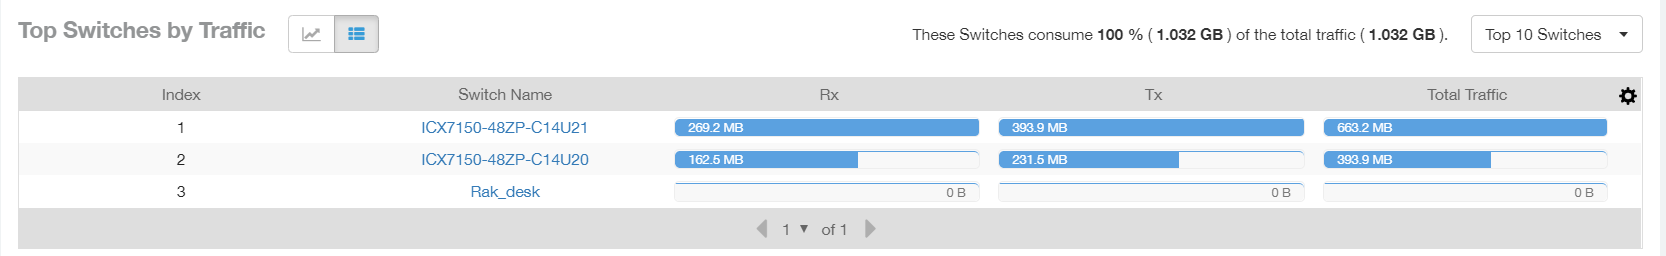
Top Switches By Traffic Tile
Use the Top Switches By Traffic donut chart and graph to view which wired switches have the most traffic. You can use the Traffic menu to show total traffic, transmitted traffic only, or received traffic only.
On the donut chart, you can pause the pointer over any area to view more details, or click on one of the areas of the donut chart to go to the Switch Details dashboard for the corresponding switch. In the line graph, you can pause the pointer to view traffic for switches at different times; you can toggle the boxes on and off to display or not display the switches they represent.
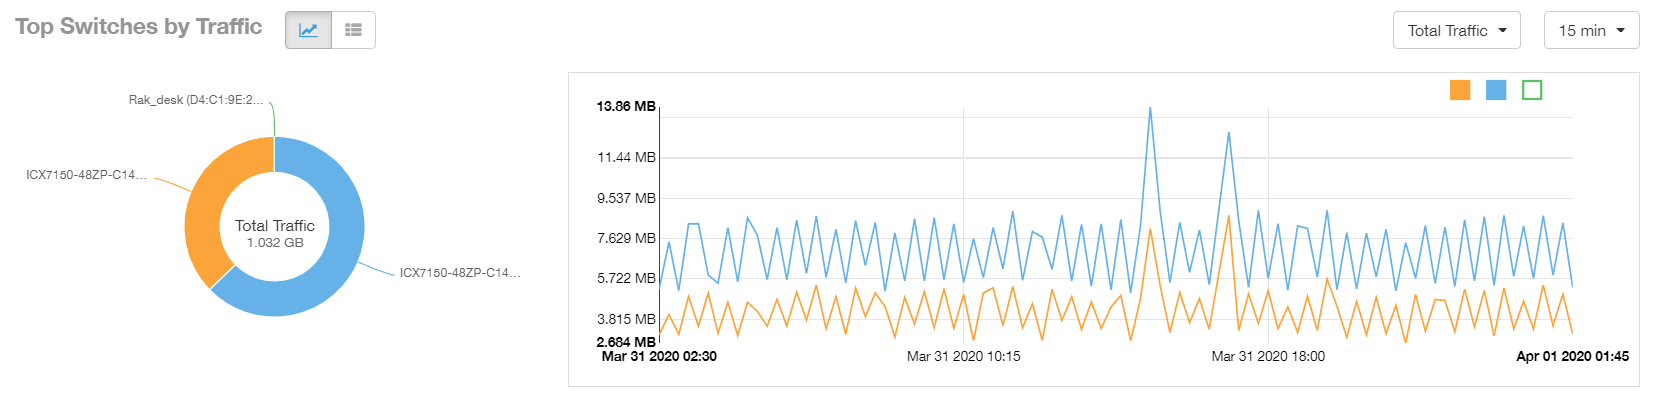
You can click various headings to sort the table as desired. You can use the menu to select the number of switches shown, and use the gear icon ( ) to include or exclude any columns.
Top Switches by PoE Usage Tile
Use the Top Switches by PoE Usage pie chart and graph of the Network - Wired report to view which wired switches are utilizing the most power over internet.
On the pie chart, you can hover over any area to view more details, or click on one of the areas of the pie chart to go to the Switch Details dashboard for the corresponding switch. In the line graph, you can hover to view switch utilization at different times; you can toggle the boxes on and off to display or not display the switches they represent.
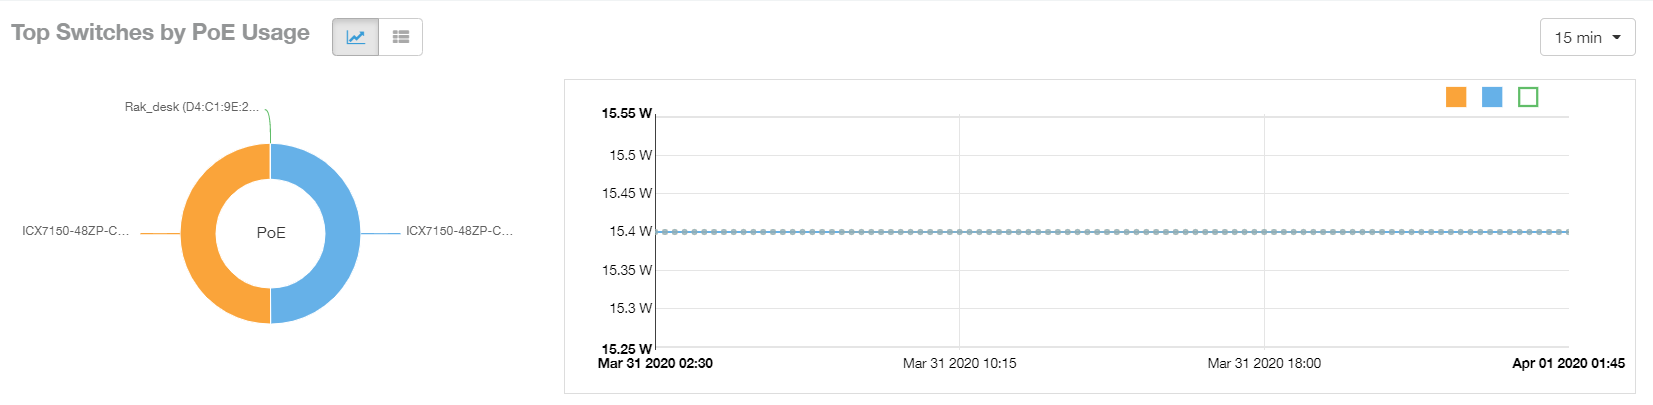
You can click various headings to sort the table as desired. You can also use the drop-down menu to select the number of switches shown, and use the gear icon to include or exclude any columns.
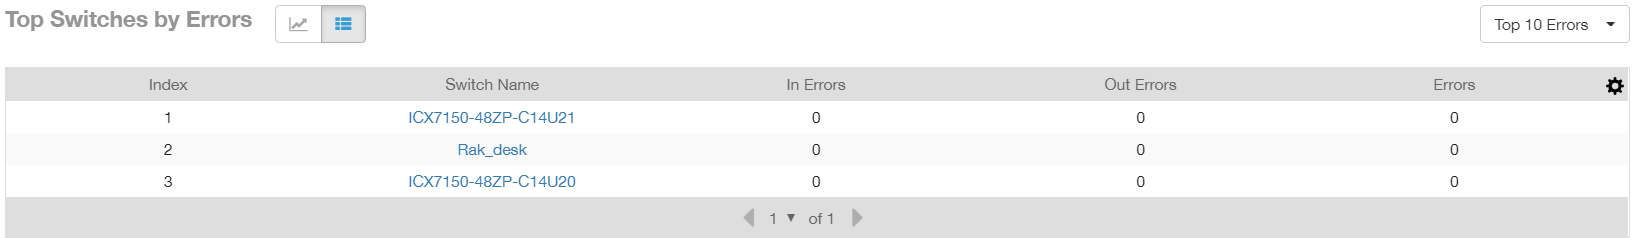
Top Switches by Errors Tile
Use the Top Switches by Errors graph of the Network - Wired report to view the error count for switches.
On the lines, you can hover over any area to view more details, or click on one of the lines to go to the Switch Details dashboard for the corresponding switch. In the line graph, you can hover to view the number of errors associated with each switch at different times; you can toggle the boxes on and off to display or not display the switches they represent. You can also choose the time duration for which you want this information to be displayed on the graph from the drop down.
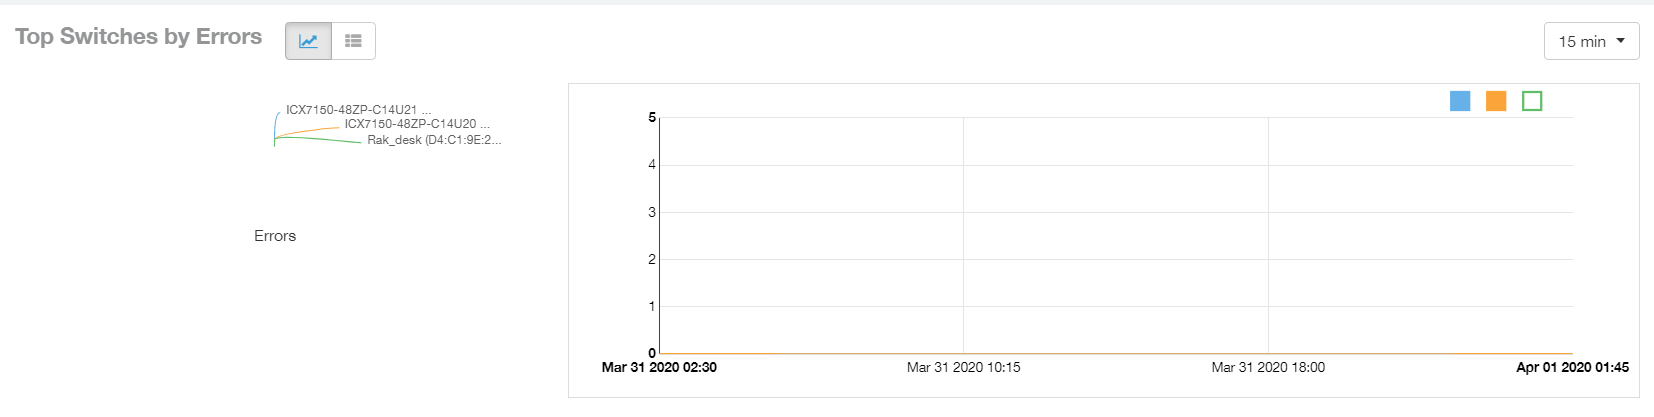
You can click various headings to sort the table as desired. You can also use the drop-down to select the number of switches shown, and use the gear icon to include or exclude any columns.
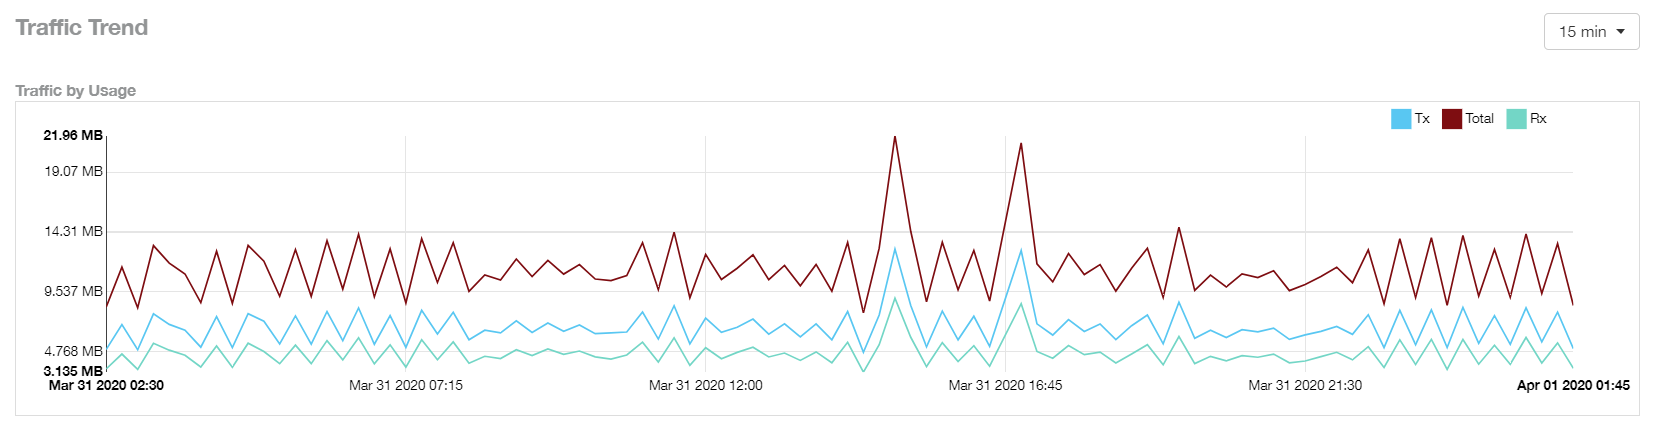
Traffic Trend Tile
The Traffic Trend section of the Network - Wired report contains two line graphs that provide traffic information about the wired switches in the network.Use the drop-down menus to specify the time frame and the granularity of the graphs.
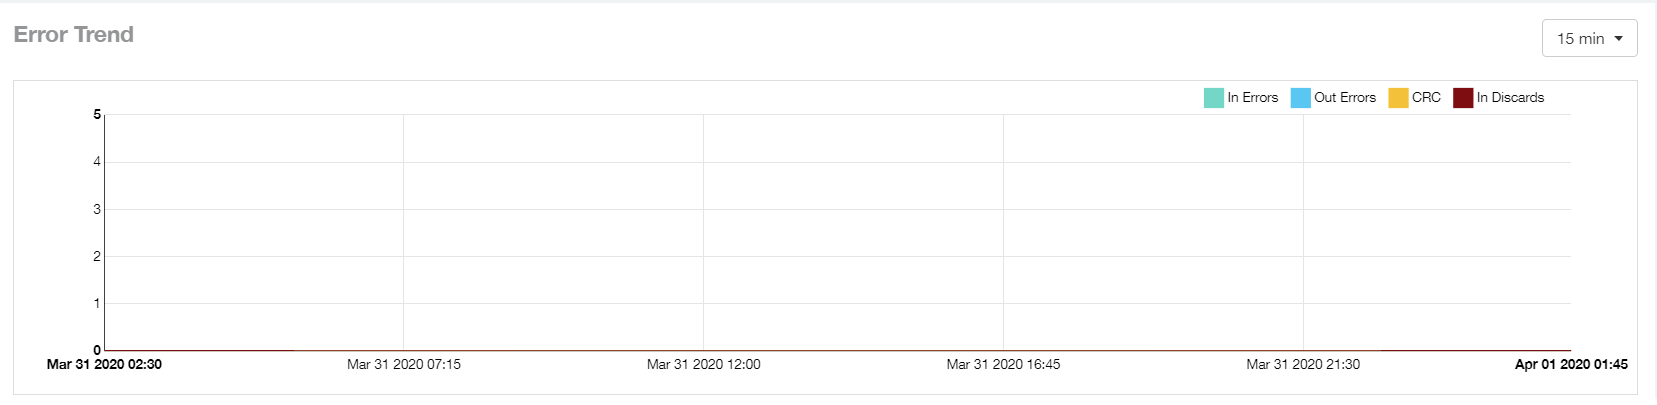
Error Trend Tile
The Error Trend section of the Network - Wired report contains a line graphs that provides the error count information - In error, Out errors, CRC and IN Discards erros over a period of time.
Use the drop-down menus to specify the time frame and the granularity of the graphs.