Wireless Report
The Wireless Report provides details of traffic, clients, and trends by APs, SSIDs, radio, or clients over time.
From the navigation bar, select Report > Network.
The following figure shows only the upper portion of the Wireless Report update.
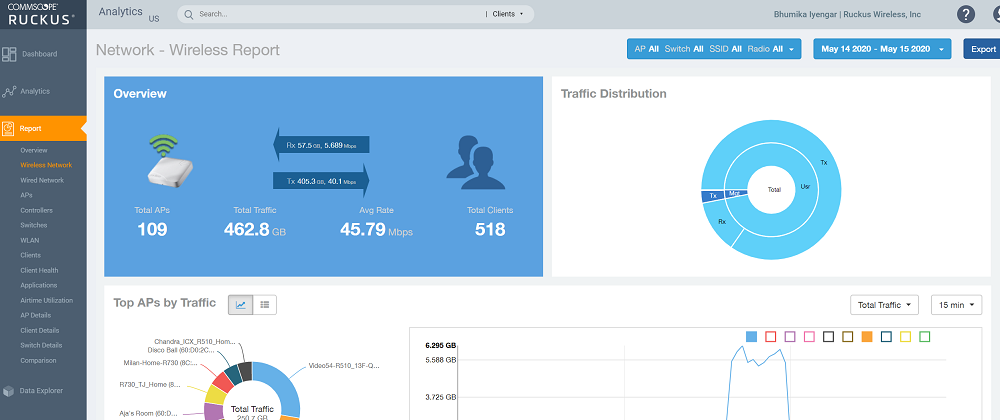
The Wireless Report consists of the following components:
- Overview tile
- Traffic Distribution tile
- Top APs by Traffic tile
- Top APs by Client Count tile
- Traffic Trend tile
- Traffic Over Time tile
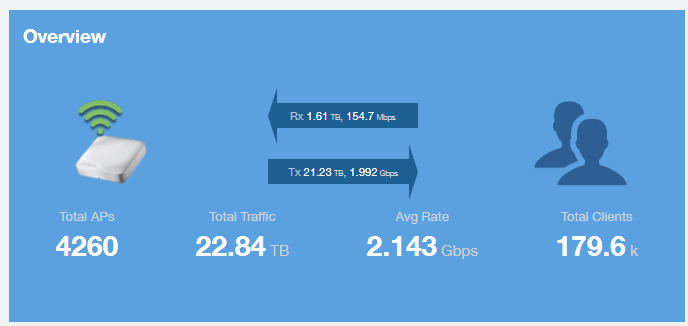
Overview Tile
- Total traffic and the average traffic rate
- Total traffic received and transmitted and the average traffic rate
- Total number of APs
- Total number of clients on the network
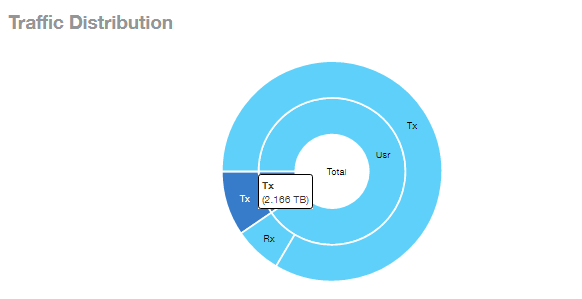
Traffic Distribution Tile
- Tx = Transmitted traffic
- Rx = Received traffic
- Mgmt = Management traffic
- Usr = User traffic
- Total = Total of all traffic
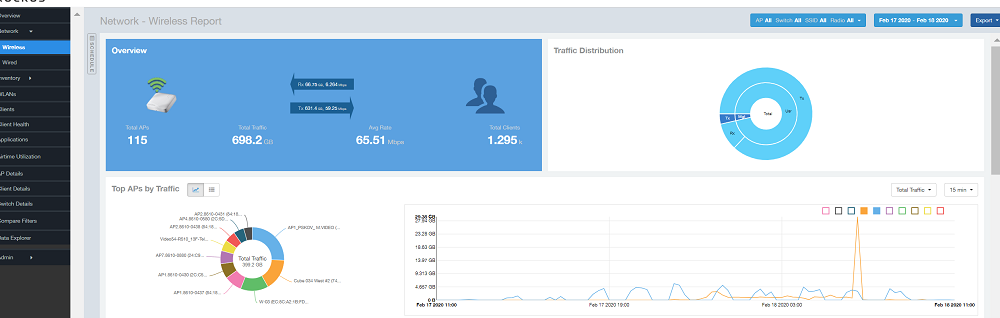
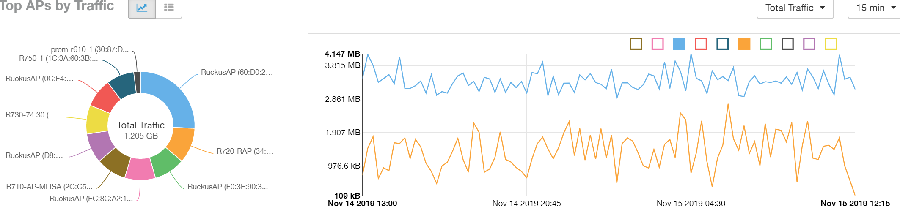
Top APs by Traffic Tile
The Top APs by Traffic tile contains a donut chart and a graph. The donut chart and graph displays the APs with the highest traffic volume in the network.
In the tile, use the menus to specify the traffic type (Tx, Rx, or Tx+Rx) and the time period. Click any of the colored squares to display the selected AP details in the line graph.
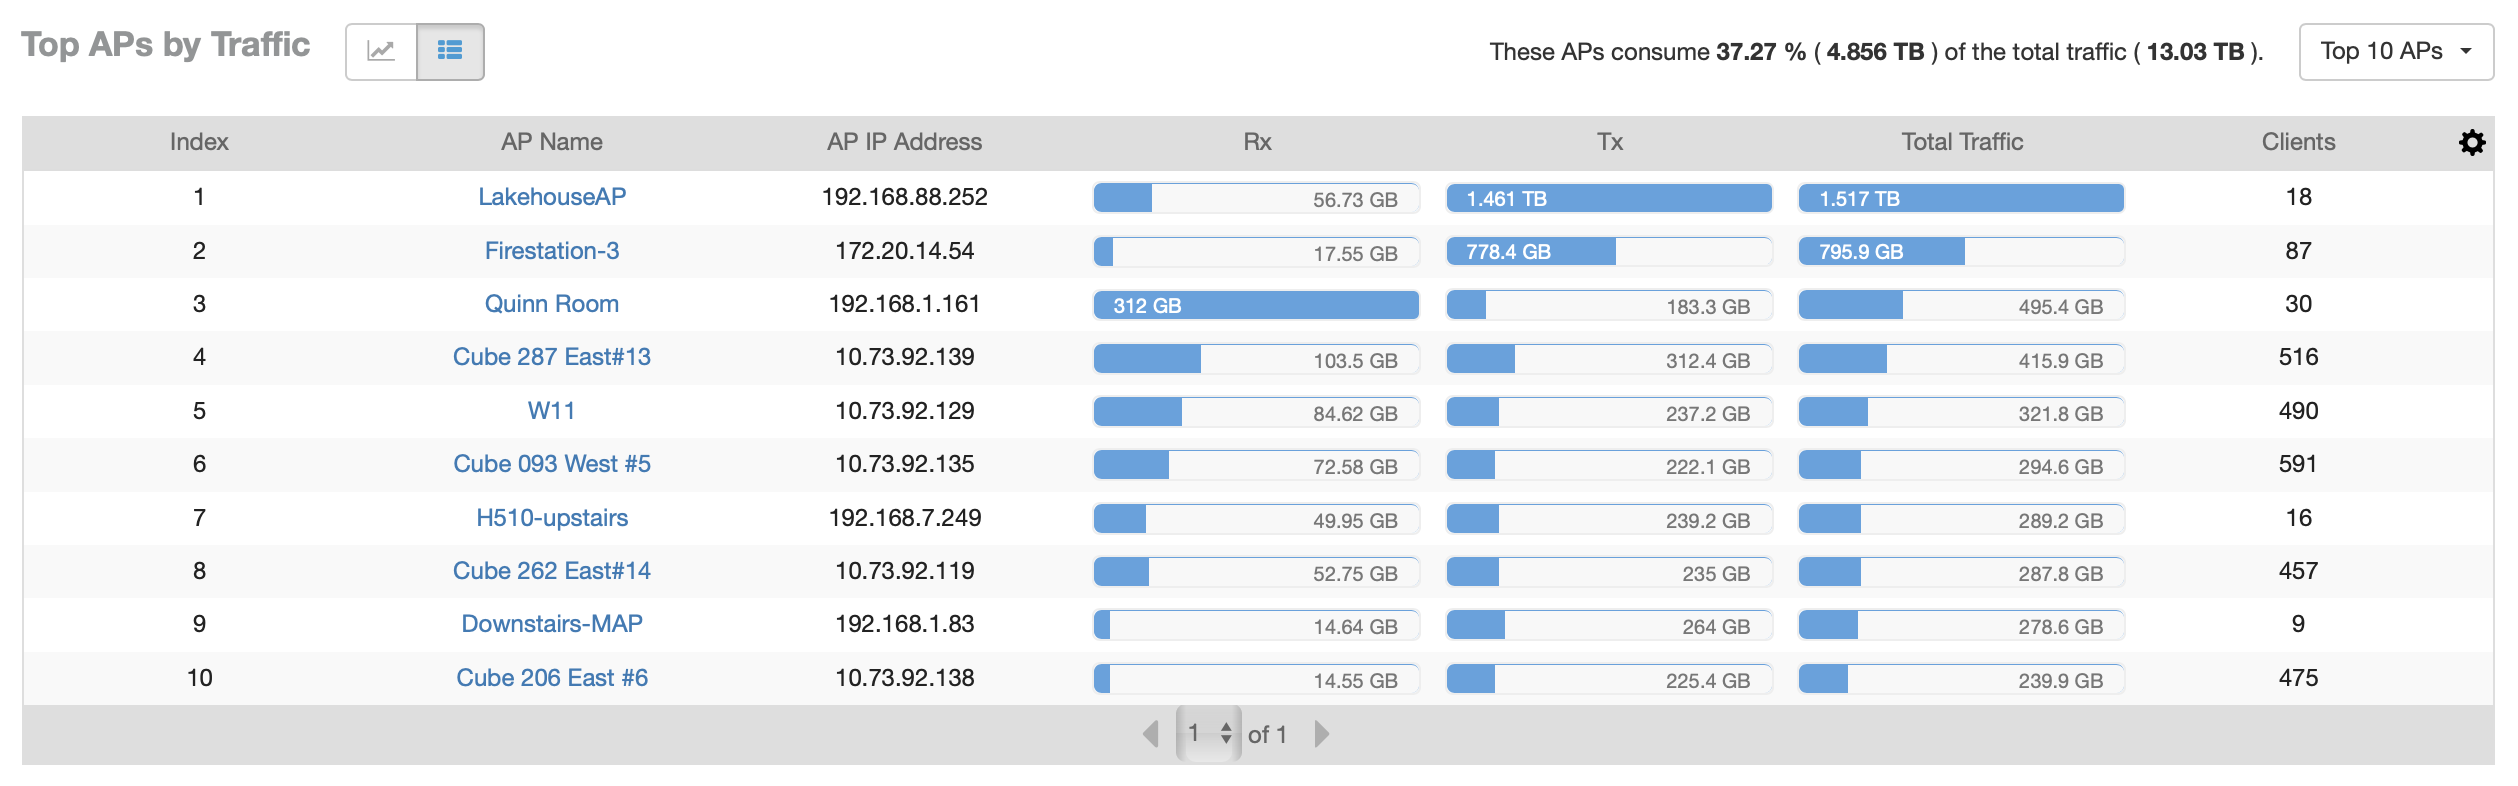
In the
Top APs by Traffic table, you can view a list of the APs with the highest traffic volume, sorted according to the selected table columns. Click the gear icon ( ) to select the columns to display, and click any column heading to sort the table by that column.
You can select whether to display the top 10, 20, 50, or 100 APs by traffic volume from the filter. The number of rows per page can be defined using the
Rows per page option in the table settings menu. Use the chart and table icons ( ) to toggle between the chart and table views.
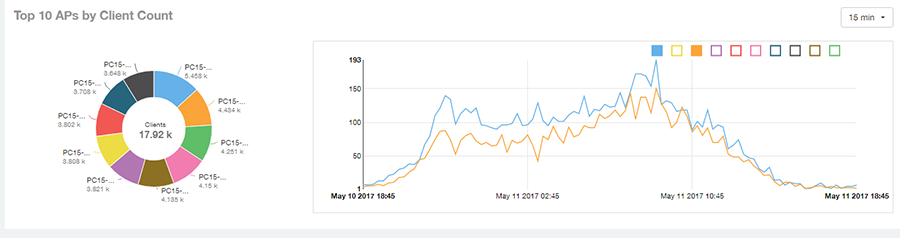
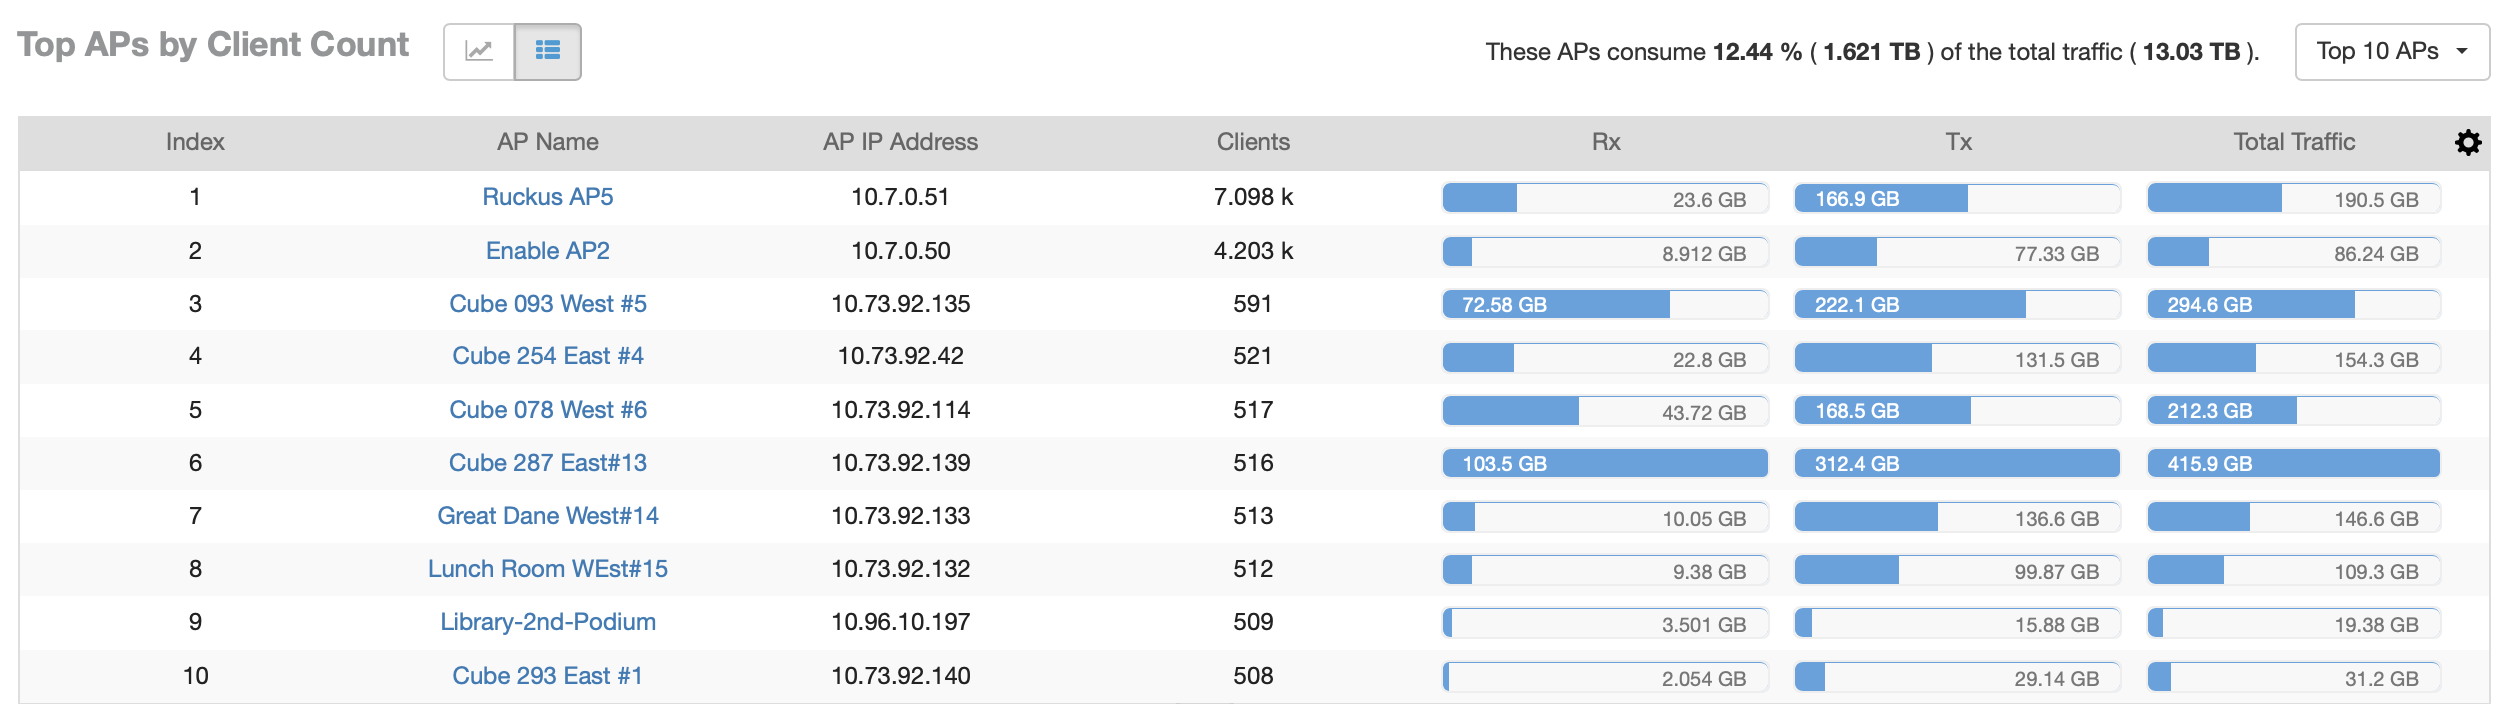
Top APs by Client Count Tile
The Top APs by Client Count tile contains a donut chart and a graph. The donut chart and graph along display the APs with the most clients on the network.
In the tile, use the menu to specify the time period of 15 minutes, 1 hour, or 1 day. If you pause the pointer over the line graph, an information box is displayed containing the details on the selected data points. Click any of the colored squares to display the selected AP details in the line graph.
In the
Top APs by Client Count table, click the gear icon () to select the columns to display, and click any column heading to sort the table by that column. You can select the top 10, 20, 50, or 100 APs count from the table settings menu. The number of rows per page can be defined using the
Rows per page option in the table settings menu. Use the chart and table icons () to toggle between the chart and table views.
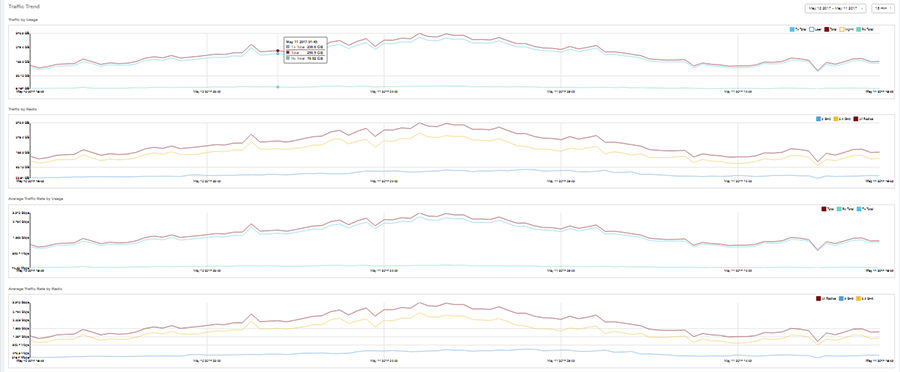
Traffic Trend Graphs
The Traffic Trend graphs of the Wireless Report display the traffic by usage and radio over time.
If you pause the pointer over the line graph, an information box is displayed containing the selected AP details.
Traffic by Usage: You can select the traffic by usage details from the check boxes listed in the legend on top of the graph: user, total received traffic, total transmitted traffic, the total received and transmitted traffic, and the management traffic. You can select a date range or a specific date on the line graph. You can specify a time period.
Traffic by Radio: You can select the traffic by the following radio details from the check boxes listed in the legend on top of the graph: 5 GHz, 2.4 GHz, and total traffic by radio details. You can select a date range or a specific date on the line graph. These options apply to the corresponding average traffic rate graphs as well.
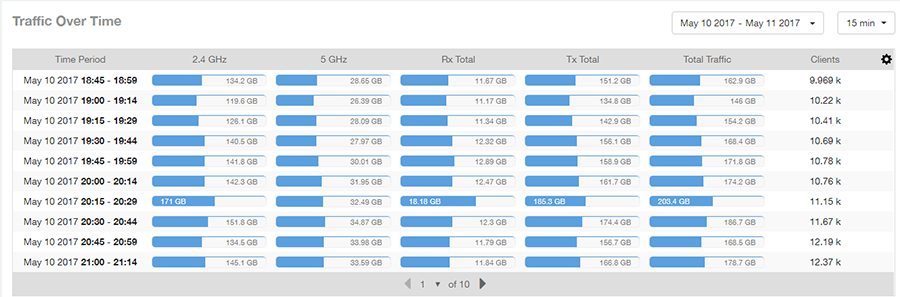
Traffic Over Time Table
The Traffic Over Time table of the Wireless Report allows you to compare traffic over multiple time periods.
Click the gear icon () to select the columns to display, and click any column heading to sort the table by that column.