Applications Report
The Applications Report provides the details of the applications accessed by the user.
The Applications Report contains the details of the applications accessed by the user and predefined by Ruckus Cloud Analytics. The overview contains the list of recognized applications. The rest of the report contains the top ten applications by traffic volume received and transmitted over time, client count, traffic, and clients.
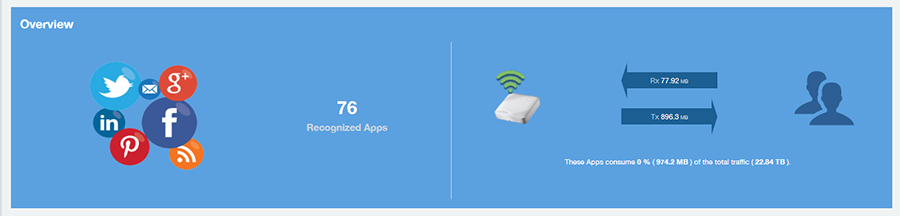
Overview Tile
The Overview tile of the Applications Report provides an overview of all applications recognized by the application-recognition engine and the traffic volumes that these applications consume.
The Overview tile displays the following information:
- The number of recognized applications
- Total traffic
- Total number of APs, which also contains the received and transmitted traffic between them
- Total number of clients on the network
Top Applications by Traffic
The Top Applications by Traffic donut chart and graph of the Applications Report display the top applications with the largest traffic in the network, along with the received and transmitted traffic.
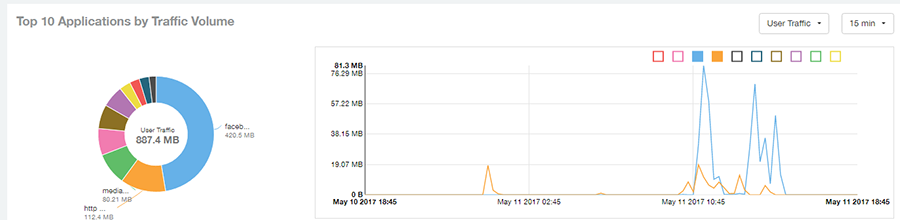
Use the chart and table icons ( ) to toggle between the chart and table views.
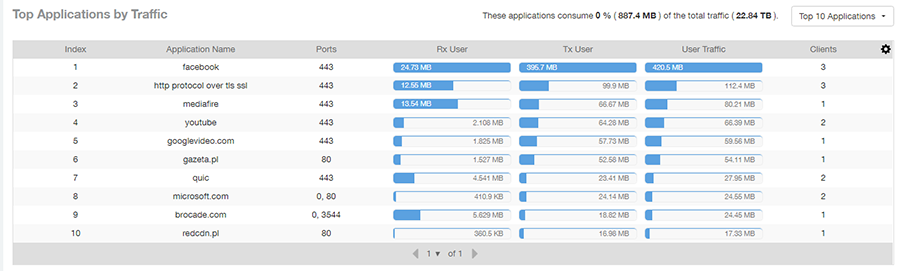
You can view the received and transmitted traffic volumes based on the Rx and Tx filter. In the graph, click any of the colored squares to display the corresponding application details in the line graph. If you pause the pointer over the line graph, an information box is displayed containing the selected details.
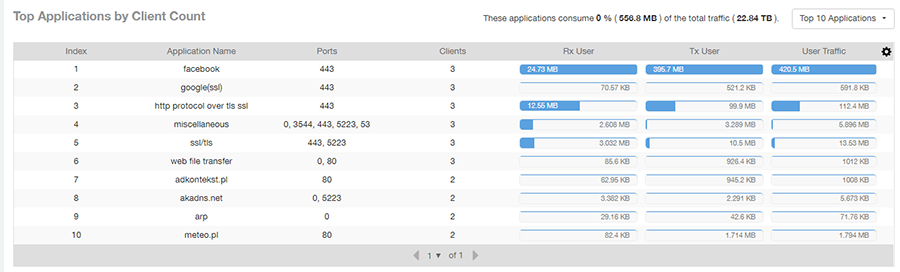
Top Applications by Client Count Tile
The Top Applications by Client Count pie chart and graph of the Applications Report show the applications that are most frequently being used by the clients in the network over specified time intervals.
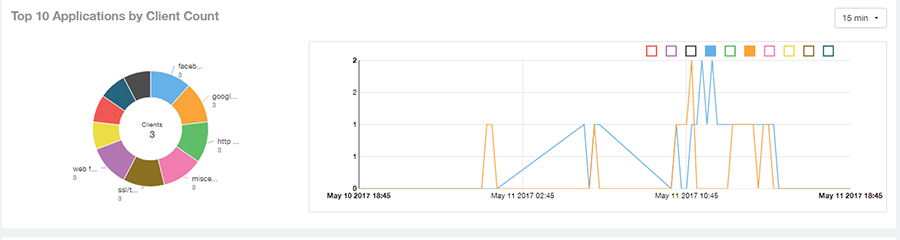
Use the chart and table icons () to toggle between the chart and table views.
Click the gear icon ( ) to select the columns to display, and click any column heading to sort the table by that column.
You can select the top 10 (default), 20, 50, or 100 applications to display, or list all applications.The number of rows in a page is defined by the Rows per Page option in the table settings menu.