Inventory - APs Report
The Inventory - APs Report provides details on AP inventory, such as AP reboots, AP software version, AP models and AP Alarms.
The following figure shows only the upper portion of the Inventory - APs dashboard that appears when you click Inventory > APs on the navigation bar.
From the navigation bar, select Report > APs.
- Overview tile
- Top APs By Offline Duration tile
- AP Count Trend tile
- AP Status Trends tile
- Top AP Models tile
- Top AP Software Versions tile
- Top 10 AP Reboot Reasons tile
- Top APs by Reboot Counts tile
- Top 10 AP Alarm Types tile
- AP Details for Online/Offline Status tile
- AP Details for Other Statuses tile
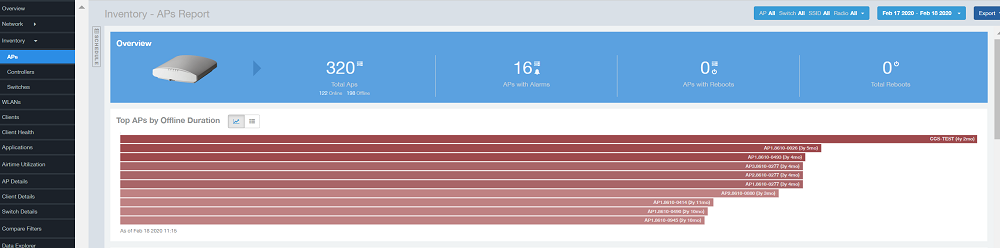
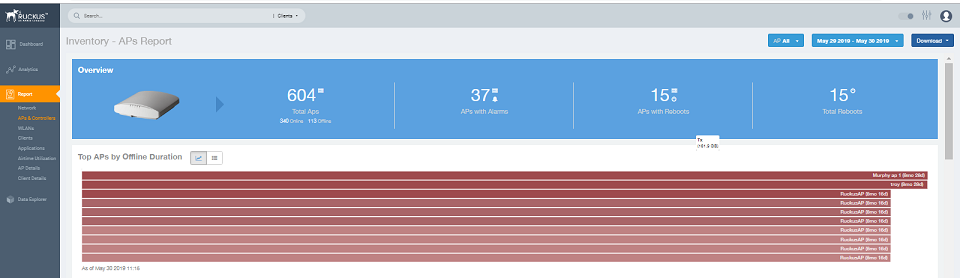
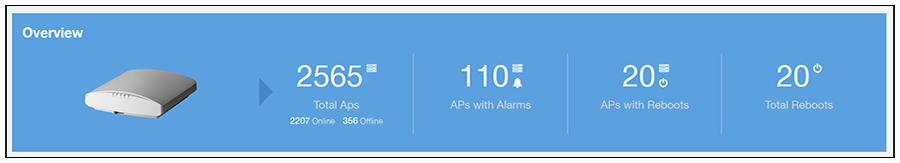
Overview Tile
The Overview tile provides a general overview of the APs on the network.
- Total APs
- APs with alarms
- APs with reboots
- Total reboots
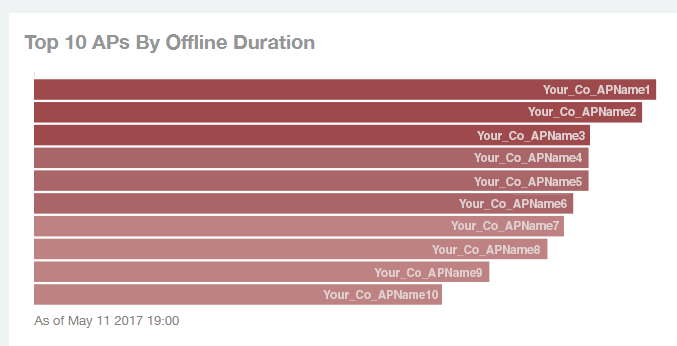
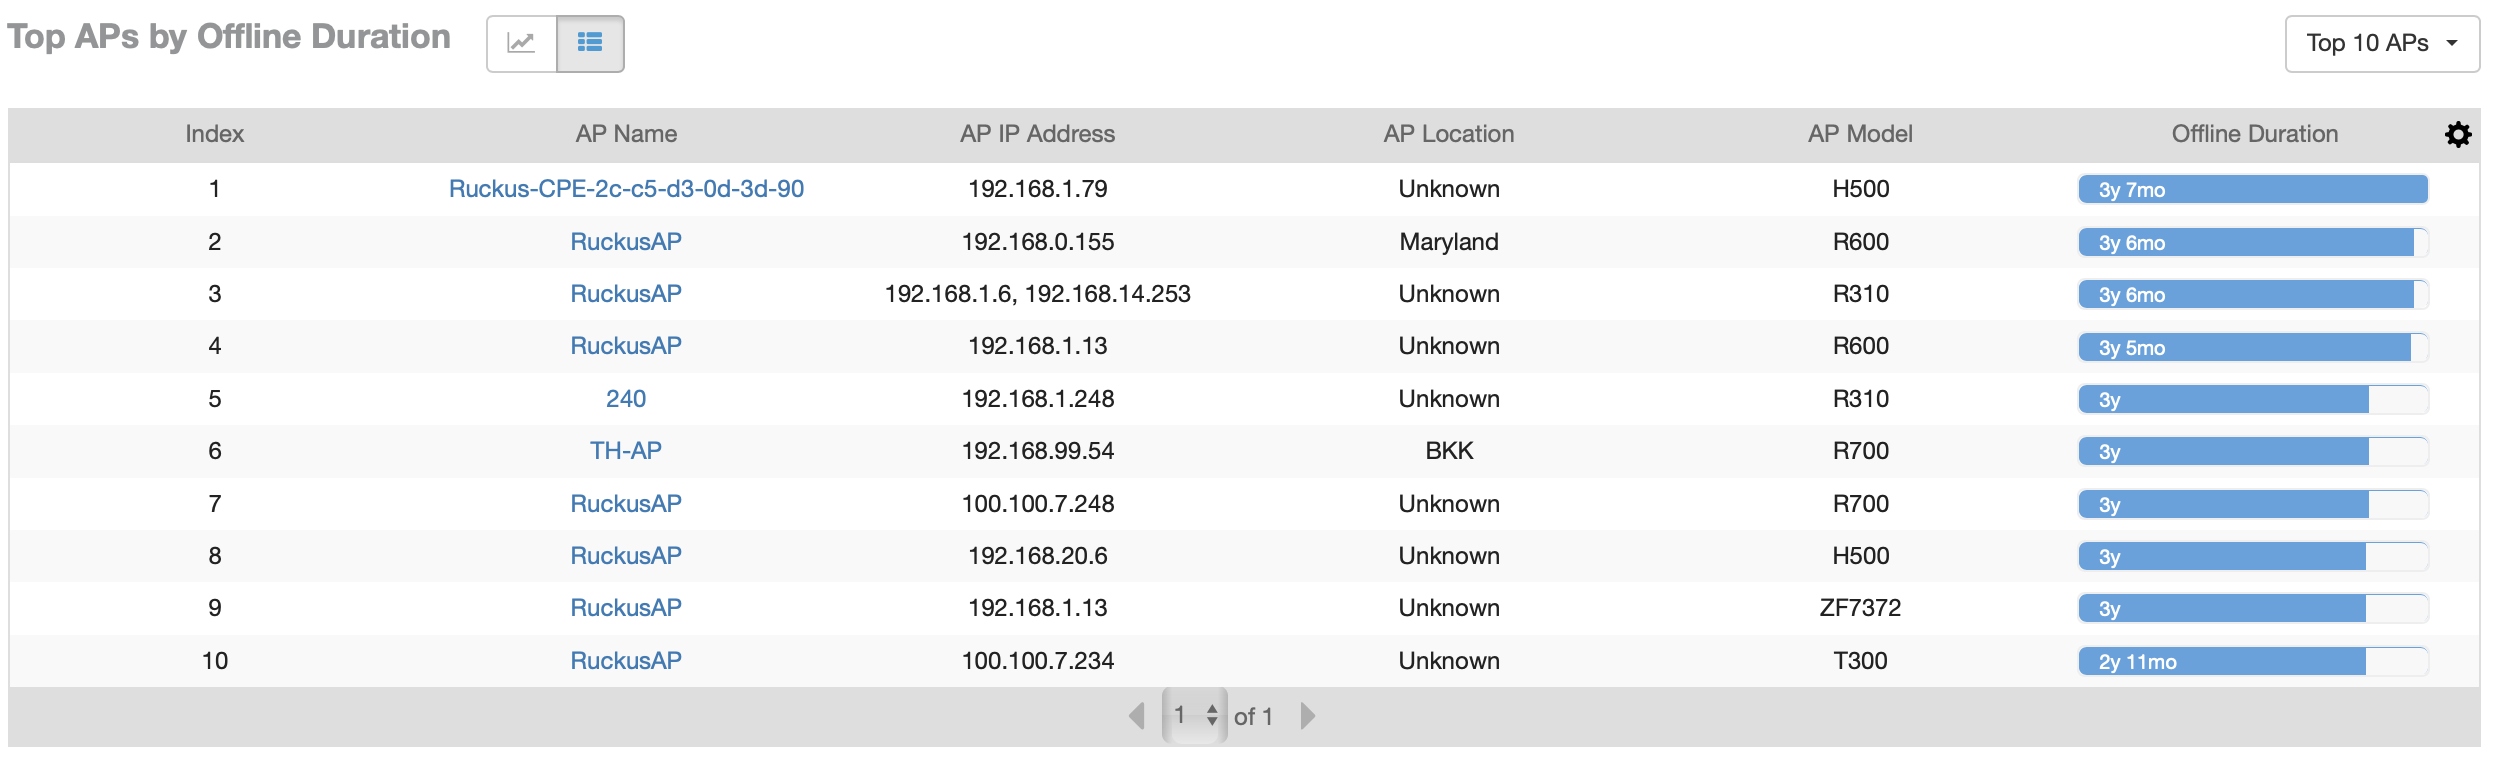
Top APs by Offline Duration Tile
The Top APs by Offline Duration tile contains a bar chart and a table. The chart/table along with the Inventory - APs Report displays the top 10 APs in the network that have been disconnected for the longest duration.
In the bar chart, use the menu to specify the time period. If you pause the pointer over the bar graph, an information box is displayed that allows you to obtain details on the selected data points.
Use the chart and table icons ( ) to toggle between the chart and table views.
The table view displays the top APs based on which ones have been offline for the longest time, The APs are listed by AP name, IP address, location, model, and duration in the table.
The table view displays the top APs based on which ones have been offline for the longest time, The APs are listed by AP name, IP address, location, model, controllers, and duration in the table.
Click the gear icon ( ) to select the columns to display, and click any column heading to sort the table by that column. You can select the top 10, 20, 50, or 100 APs by offline duration. The number of rows in a page is defined by the
Rows per Page option in the table settings menu.
) to select the columns to display, and click any column heading to sort the table by that column. You can select the top 10, 20, 50, or 100 APs by offline duration. The number of rows in a page is defined by the
Rows per Page option in the table settings menu.
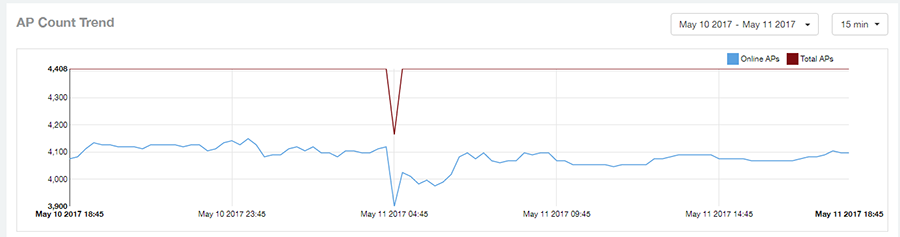
AP Count Trend Graph
The AP Count Trend graph depicts how many APs in your network are being utilized over time.
To show APs being used over certain time periods, use the menu to specify the time period. If you pause the pointer over the line graph, an information box is displayed containing the details on the selected data points. Click any of the colored squares to display the selected AP details in the line graph..
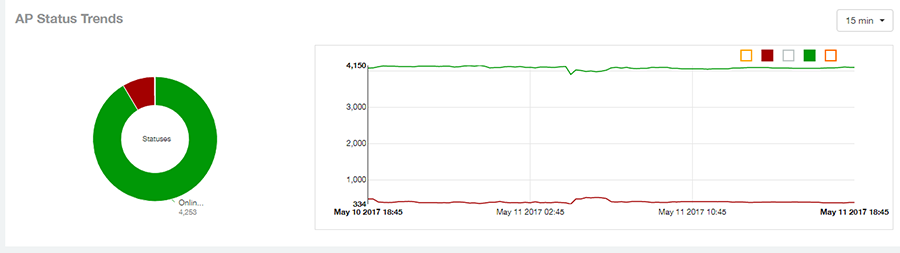
AP Status Trends Tile
The AP Status Trends tile contains a donut chart and a graph that display the top APs by connection and uptime status, such as online, offline, provisioned, discovery, and other classifications.
Use the drop-down menu to specify the time granularity. If you pause the pointer over the donut chart and the line graph, an information box is displayed containing the details on the selected data points. Click any of the colored squares to display the selected AP details in the line graph.
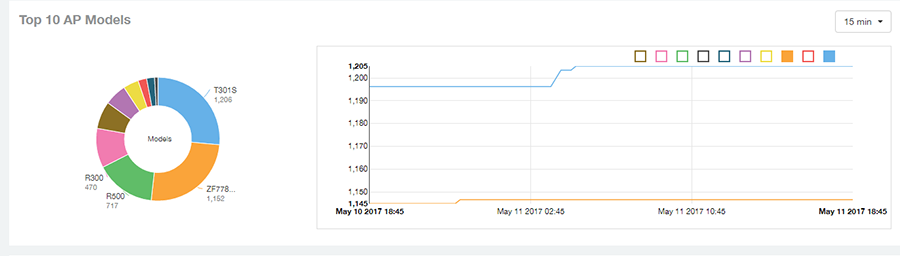
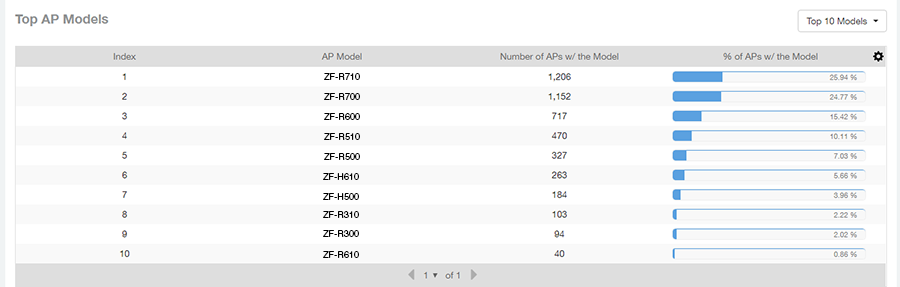
Top AP Models
The Top AP Models tile contains a donut chart and a graph. The donut chart and graph display the model type that is most often used in your network.
In the chart, use the menu to specify the time period. If you pause the pointer over the donut chart and the line graph, an information box is displayed containing the details on the selected data points. Click any of the colored squares to display the selected AP details in the line graph.
 ) to toggle between the chart and table views.
Click the gear icon () to select the columns to display, and click any column heading to sort the table by that column. You can select the top 10, 20, 50, or 100 models to display. The number of rows in a page is defined by the
Rows per Page option in the table settings menu.
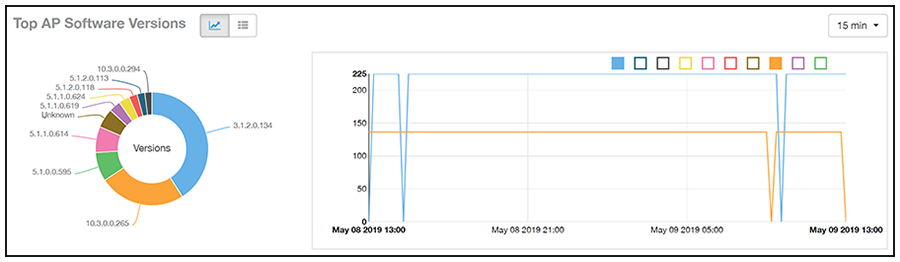
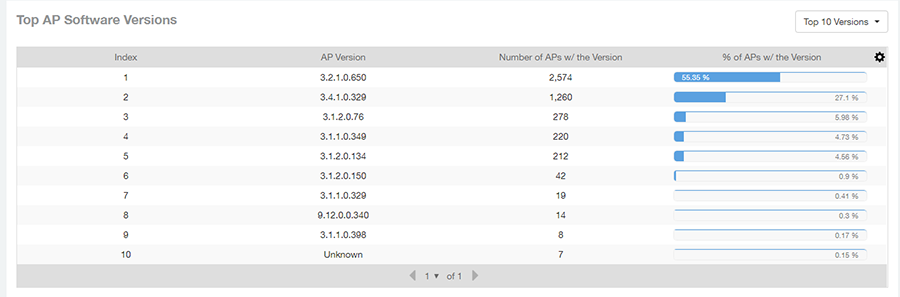
Top AP Software Versions Tile
The Top AP Software Versions tile are represented as a chart and table. The donut chart and graph displays the most-used software versions in your network, and show how many APs are using each version.
In the chart, use the menu to specify the time period. If you pause the pointer over the donut chart and the line graph, an information box is displayed containing the details on the selected data points. Click any of the colored squares to display the selected AP details in the line graph.
 ) to toggle between the chart and table views.
Click the gear icon () to select the columns to display, and click any column heading to sort the table by that column. You can also select the top 10 (default value), 20, 50, or 100 clients to display, or display all AP models. You can select the top 10, 20, 50, or 100 models to display. The number of rows in a page is defined by the
Rows per Page option in the table settings menu.
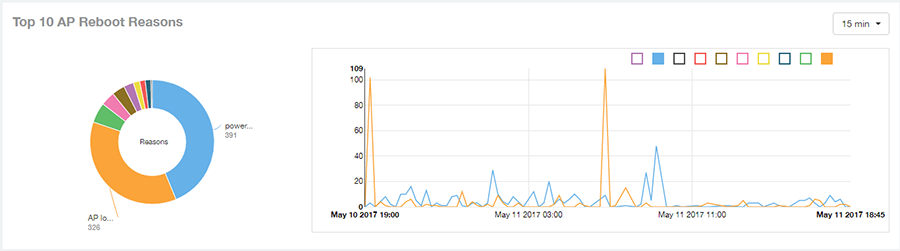
Top 10 AP Reboot Reasons Tile
The Top 10 AP Reboot Reasons tile contains a donut chart and a graph that display the ten most common reasons why APs in your network have rebooted.
Use the menu to specify the time granularity. If you pause the pointer over the donut chart and the line graph, an information box is displayed containing the details on the selected data points. Click any of the colored squares display the selected AP details in the line graph.
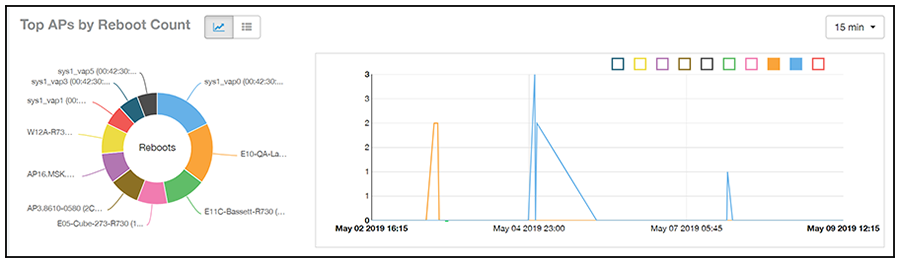
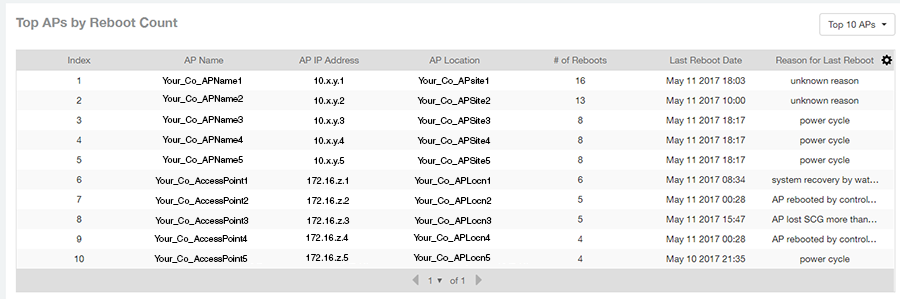
Top APs by Reboot Count Tile
The Top APs by Reboot Count tile contains a donut chart and a graph. The donut chart and graph display the top ten APs in your network that have rebooted most frequently.
Use the menu to specify the time granularity. If you pause the pointer over the donut chart and the line graph, an information box is displayed containing the details on the selected data points. Click any of the colored squares to display the selected AP details in the line graph.
 ) to toggle between the chart and table views.
Click the gear icon () to select the columns to display, and click any column heading to sort the table by that column. You can select the top 10, 20, 50, or 100 models to display. The number of rows in a page is defined by the
Rows per Page option in the table settings menu.
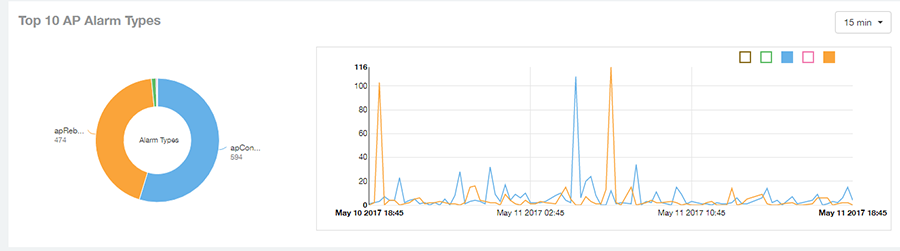
Top 10 AP Alarm Types Tile
The Top 10 AP Alarm Types donut chart and line graph display the ten alarm types that have most frequently occurred to APs in your network.
Use the menu to specify the time period. If you pause the pointer over the donut chart and the line graph, an information box is displayed containing the details on the selected data points. Click any of the colored squares to display the selected AP details in the line graph.
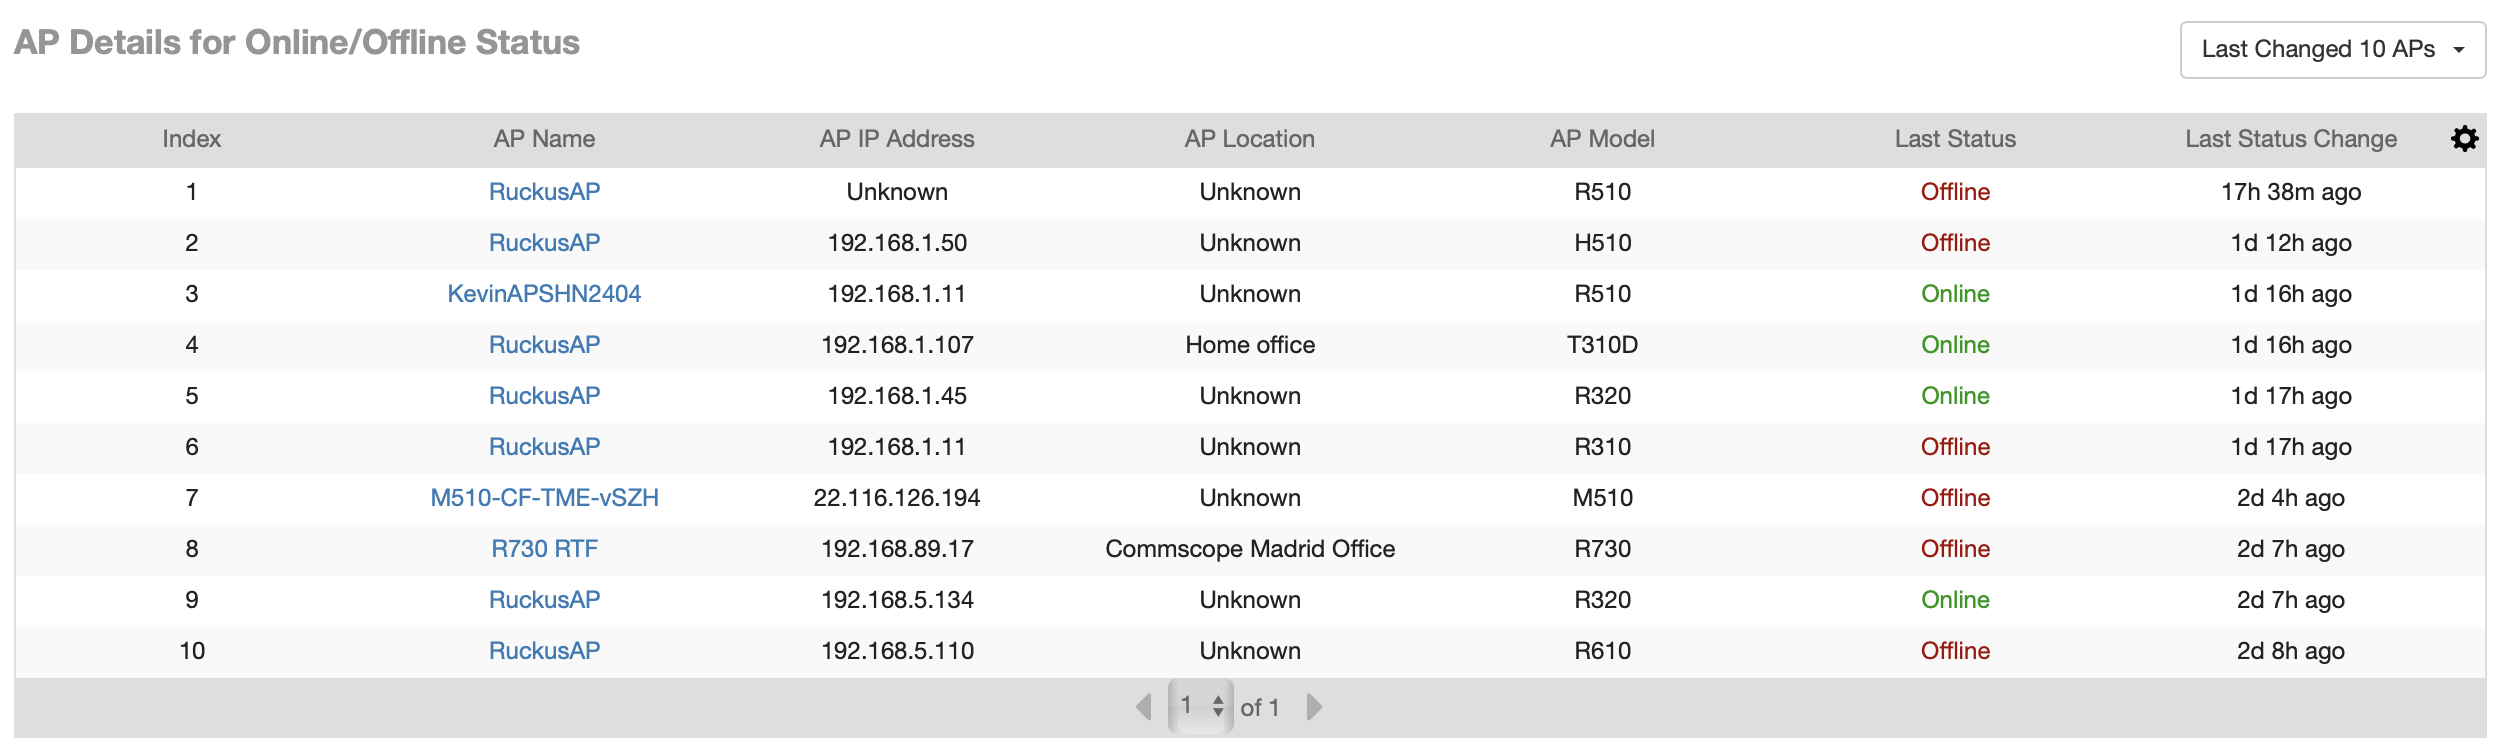
AP Details for Online/Offline Status Table
The AP Details for Online/Offline Status table of the Inventory - APs Report displays its status details based on AP name, IP address, location, model name, controller name, last status, and last status change.
The AP Details for Online/Offline Status table of the Inventory - APs Report displays its status details based on AP name, IP address, location, model name, last status, and last status change.
Click the gear icon () to select the columns to display, and click any column heading to sort the table by that column. You can select the top 10, 20, 50, or 100 models to display. The number of rows in a page is defined by the
Rows per Page option in the table settings menu.
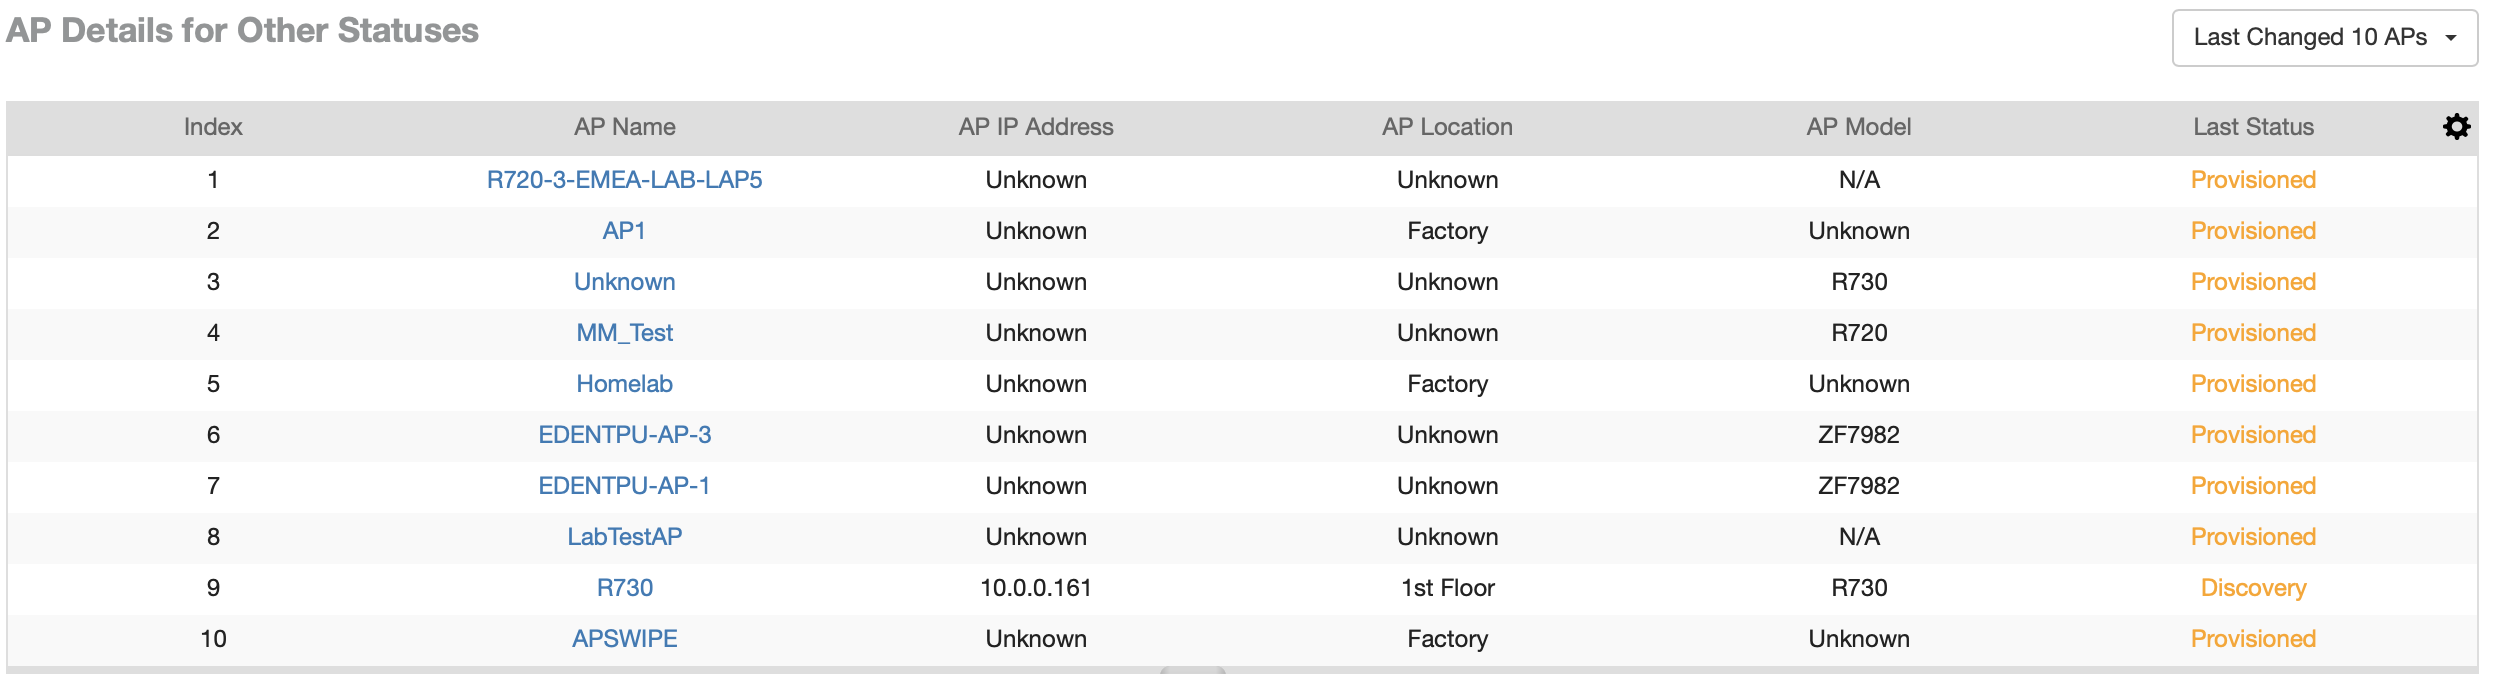
AP Details for Other Statuses Table
The AP Details for Other Statuses table of the Inventory - APs Report displays the details for APs that are currently in a status other than online or offline.
Click the gear icon () to select the columns to display, and click any column heading to sort the table by that column. You can select the top 10, 20, 50, or 100 models to display. The number of rows in a page is defined by the
Rows per Page option in the table settings menu.