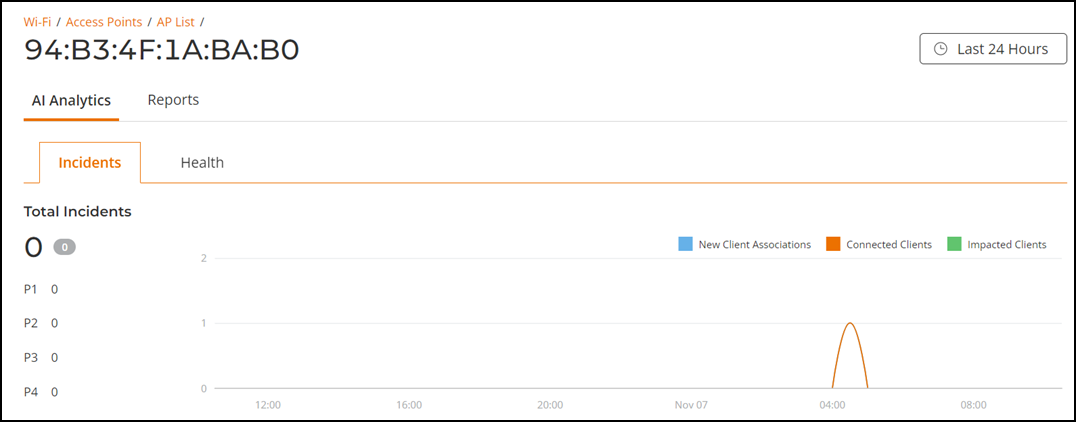
AP AI Analytics
The AP AI Analytics page provides information about the incidents that have occurred on the selected AP and displays the health of the selected AP.
- On the Navigation bar, click . The AP List page is displayed.
- Click AP Name attribute of the selected AP. The AP AI Analytics and Reports page of the selected AP is displayed. By default, AI Analytics page is selected.

- Incidents
- Health
Incidents Tab
The Incidents tab provides a breakdown of incidents by severity and category, allowing you to focus on incidents of interest, for which they can view details. For any given incident, you can view the severity, client impact, root cause, and recommendations, as well as the events, anomalies, data, or problems that were used to identify the incident.
The Date and Time filter is displayed in the upper-right corner of the Content panel. This option controls the elements displayed within the Content Panel. To modify these options, refer to Content Panel.
- Severity tile
- Incident Timeline tile
- Incidents Table
All the Incidents tab components listed above are explained in detail on the Incidents section. Refer to Incidents.
You can mute and unmute the incidents displayed in the incidents table. You can also view the muted incident in the incidents table. For more information, refer to Incidents.
Health tab
Click Health tab to view the health details of the selected AP.
The Health tab provides information about network health by giving insights about key performance indicators (KPIs) of the selected AP. The information provided by the Health tab allows you to analyze the selected AP health and behavior in real time.
- Unique Connected Clients tile
- Overview tab
- Connection tab
- Performance tab
- Infrastructure tab
All the Health tab components listed above are explained in detail on the Health section. Refer to Monitoring Wireless Network Health.