Wi-Fi Network Reports
The Wi-Fi Network Reports page contains information about the incidents, clients, and applications connected to the selected Wi-Fi network.
- On the Navigation bar, click . The Wi-Fi Network List page is displayed.
- Click Name attribute of the selected Wi-Fi Network. The Wi-Fi Network Incidents and Reports page is displayed.
- Click Reports. The Wi-Fi Network Reports page is displayed.
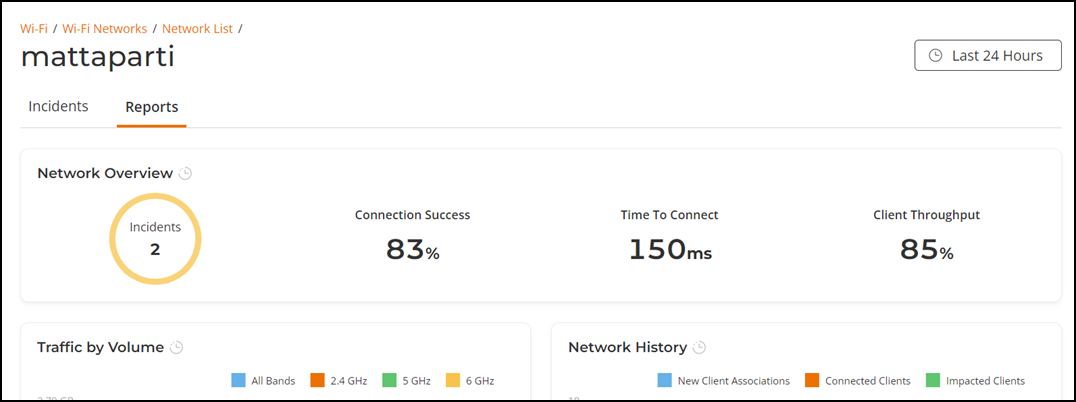
The Wi-Fi Network Reports page has the following components:
- Network Overview tile
- Traffic by Volume tile
- Network History tile
- Connected Clients Over Time tile
- Top Applications by Traffic tile
The Date and Time filter are displayed in the upper-right corner of the Content panel. This option controls the elements displayed within the Content Panel. To modify this option, refer to Content Panel.
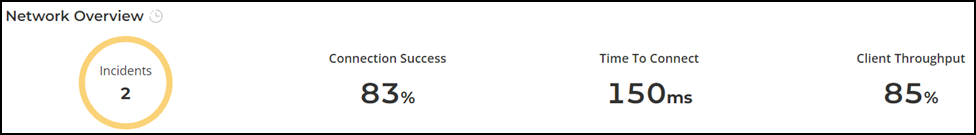
Network Overview Tile
The Network Overview tile provides general information about the total number of incidents, connection success percentage, average time to connect, and client throughput percentage for the selected time period in the Date and Time filter.
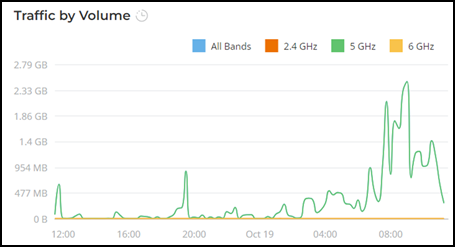
Traffic by Volume Tile
The Traffic by Volume tile contains a graph that displays the volume of traffic over the selected Wi-Fi network for the selected time period in the Date and Time filter. Pausing the pointer over the graph displays an information box with the traffic information for all the radio bands at that time and date.
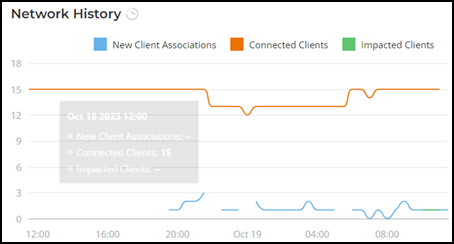
Network History Tile
- Blue line: This line represents the new client association. The client count value includes all unique clients that attempted to connect to the network, including both failed and successful connections.
- Orange line: This line represents the connected clients. The client count value indicates only successfully connected clients to the network.
- Green line: This line represents the impacted clients. The client count value includes the number of clients impacted by the incidents, and it also includes clients who were unable to connect.
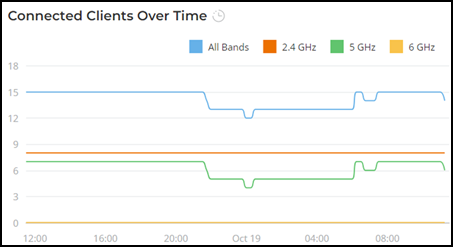
Connected Clients Over Time Tile
The Connected Clients Over Time tile contains a graph that displays the count of clients connected to the selected Wi-Fi network for the selected time period in the Date and Time filter. Pausing the pointer over the graph displays an information box with the client connected count information for all the radio bands at that time and date.
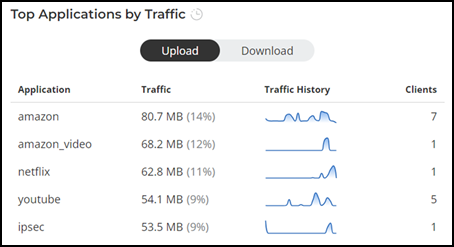
Top Applications by Traffic Tile
The Top Applications by Traffic tile contains a table that displays the top applications with the largest upload and download traffic for the selected Wi-Fi network for the selected time period in the Date and Time filter. Use the Upload and Download icons to toggle between the upload and download table views.
The table has the following attributes:
- Application: Displays the applications being used more frequently by the clients on the selected Wi-Fi network.
- Traffic: Displays the traffic information for the applications being used on the selected Wi-Fi network.
- Traffic History: Displays the histogram of traffic history.
- Clients: Displays the count of clients using the applications on the selected Wi-Fi network.