Client Health Report
The Client Health Report page calculates and displays a client health score to quickly assess the health of client connections.
The score is determined by the following metrics:
RSSI
SNR
Throughput
MCS (for transmission)
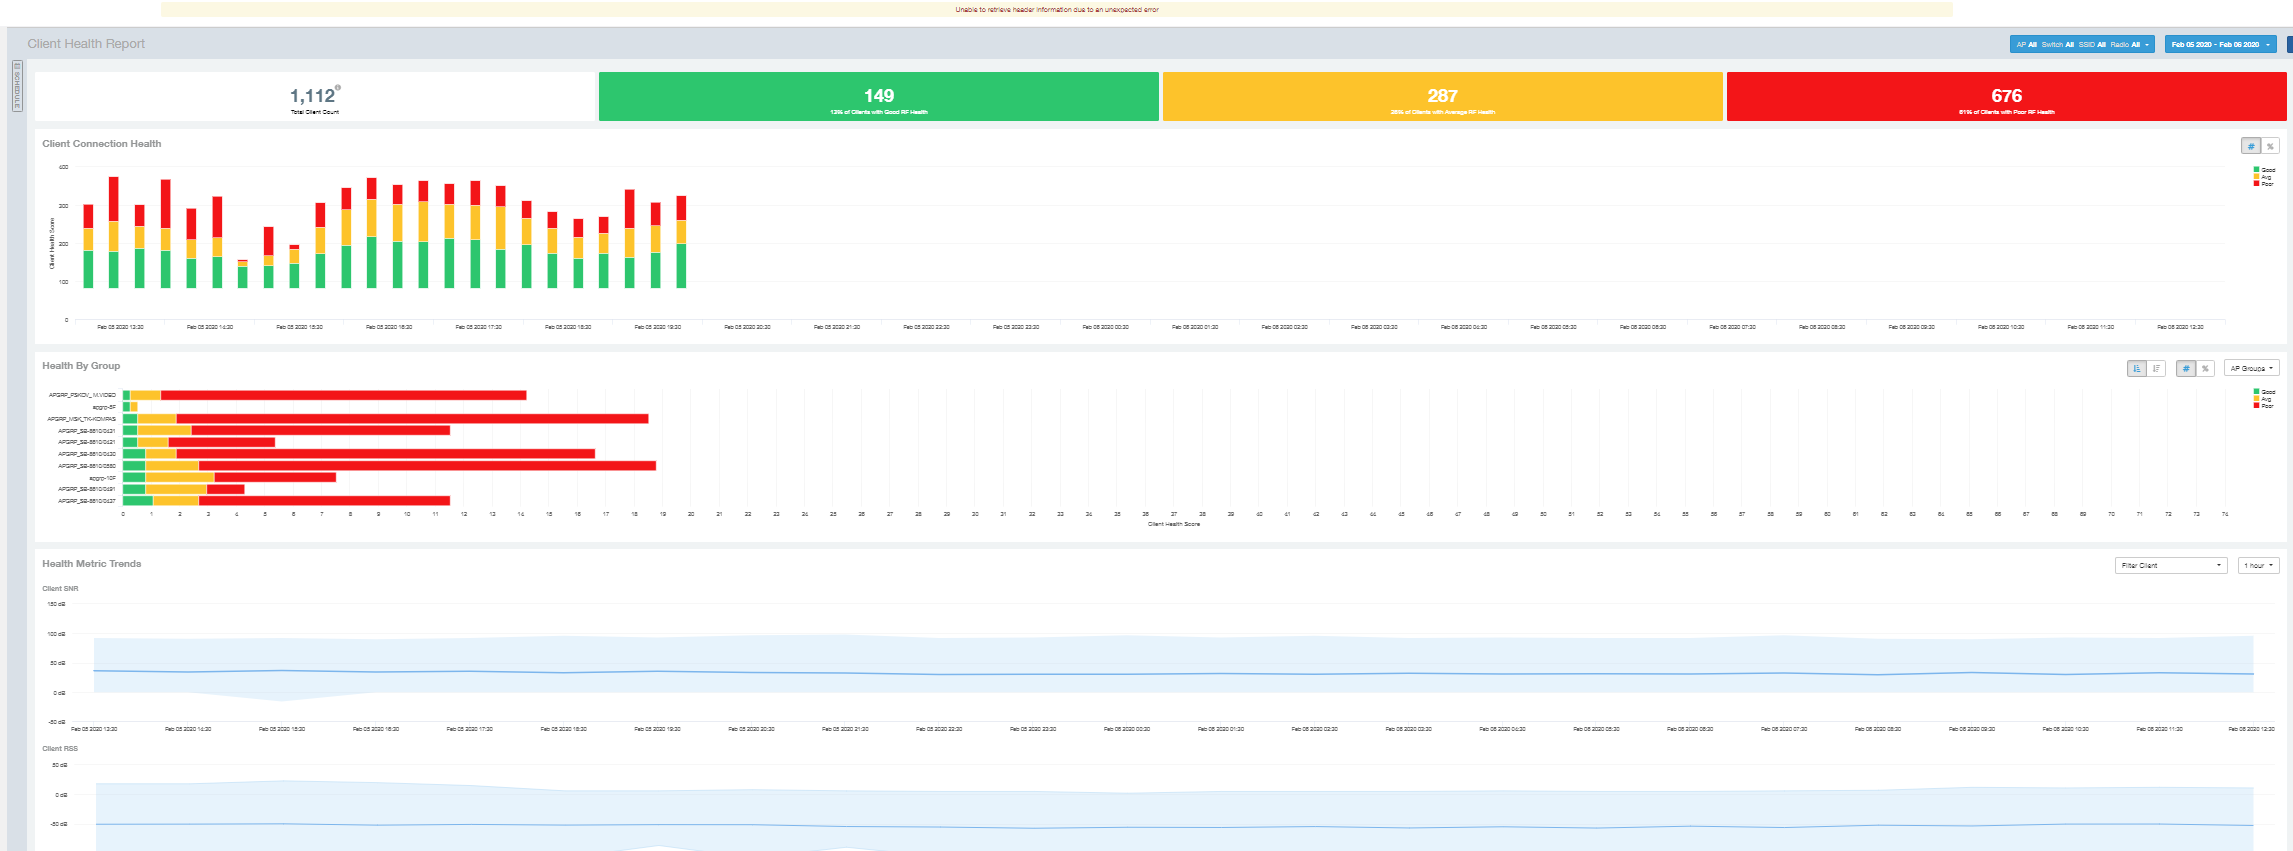
The Client Health Report consists of the following components:
Header tile
Client Connection Health tile
Health by Group tile
Health Metric Trends graphs
Header Tile
The header tile shows a summary of client health data for the selected time, by displaying the total clients that have been assigned the client score, and the status of these clients based on their RF health. The RF health is depicted as three colored boxes; each color indicating a status. The client count for each RF health status is also displayed.
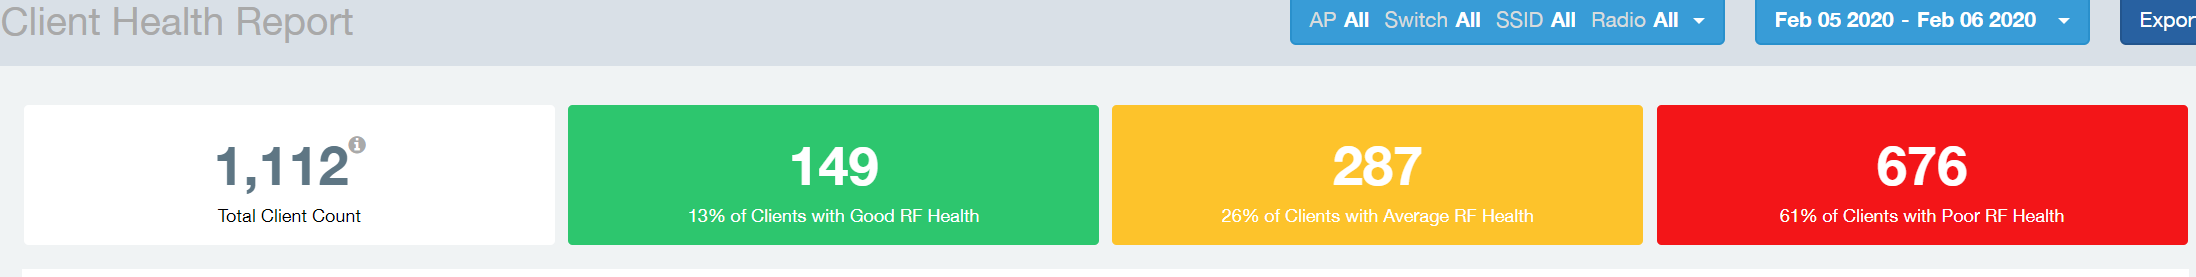
The green box shows the number of clients with good RF health. The yellow box shows the number fo clients with average RF health and the red box displays the number of clients with poor RF heath. The numbers are determined by the threshold that you set as per your expectations of client health in the network.
For example, here, out fo 1112 clients in total, 149 have good RF heath, 287 have average RF health, and 676 clients ahve poor RF health.
Client Connection Health Tile
The Client Connection Health chart displays the client health score against a specific time range such as an hour, for example. You can toggle to view the chart in two ways - as (# icon) count, or as (% icon) percentage. Count shows the client health score as good, average, and poor as a stacked color bar, and Percentage shows the percentage of clients at a time (aggregation) as a 100% stacked color bar. You can hover over the bar graph to view more details.
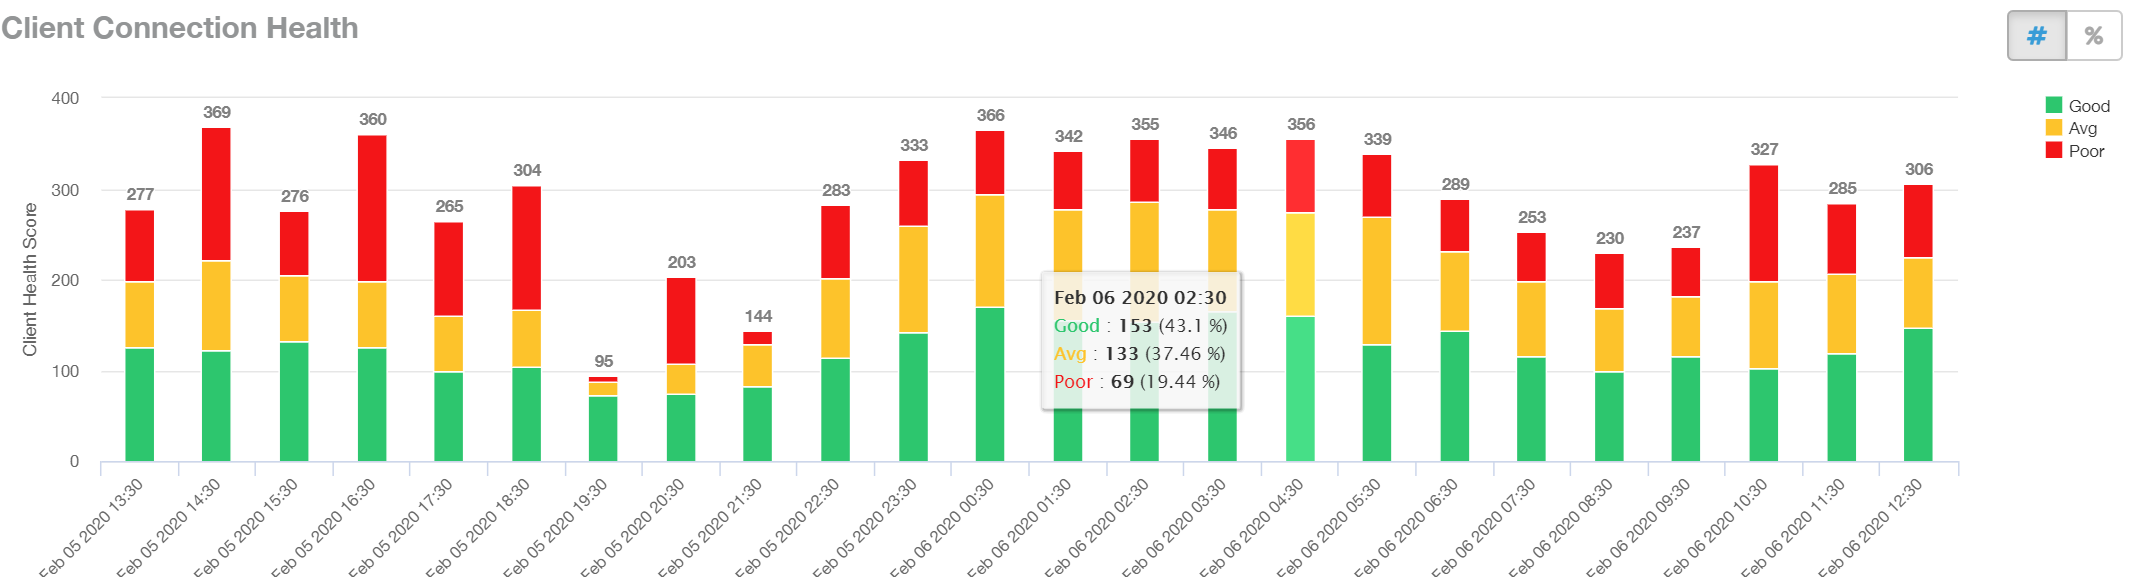
You can toggle the boxes on and off to display or not display clients classified by their score. For example, to only view the clients with a good score, you can disable the yellow and red boxes; you will only see the clients with a good RF health in the graph.
Health by Group Tile
The Health by Group chart displays the impact of RF health across the group hierarchy, which helps identify top performing and worst performing clients in the network. The group hierarchy level available are System, Domain, Zone, AP, and AP Group. Based on the group selected from the drop-down, stacked color bars are displayed depicting the client score for the group selected.
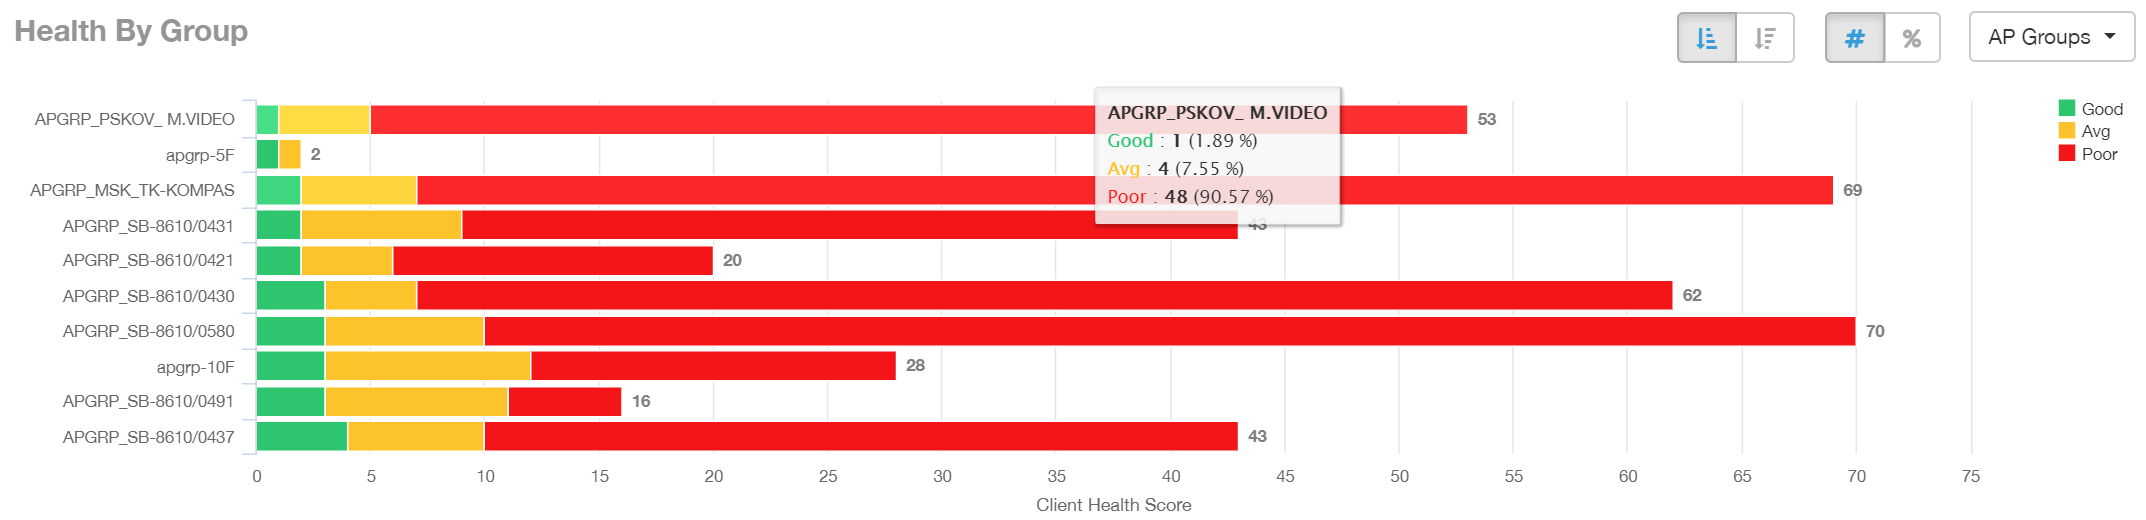
You can toggle to view the chart in two ways - as (# icon) count, or as (% icon) percentage. Count shows the client health score as good, average, and poor as a stacked color bar, and Percentage shows the percentage of clients at a time (aggregation) as a 100% stacked color bar. You can hover over the bar graph to view more details.
The top performing values or good scores are used to sort the data.
The ascending and descending order icons sort the groups as groups with highest percentage or count of good clients, and highest percentage or count of poor clients, respectively.
You can toggle the boxes on and off to display or not display clients classified by their score.
Health Metric Trends Graphs
The Health Metric Trend graphs show the raw metrics that are used to compute the client health score; this impacts the header tile, client connection tile, and the health by group tile. The raw metrics used for the computation are RSSI, SNR, MCS (Tx) and client throughput. The graphgs are plotted over a range of time. You can also select the time range from the drop-down. Options include 1 hour, 1 day and so on.
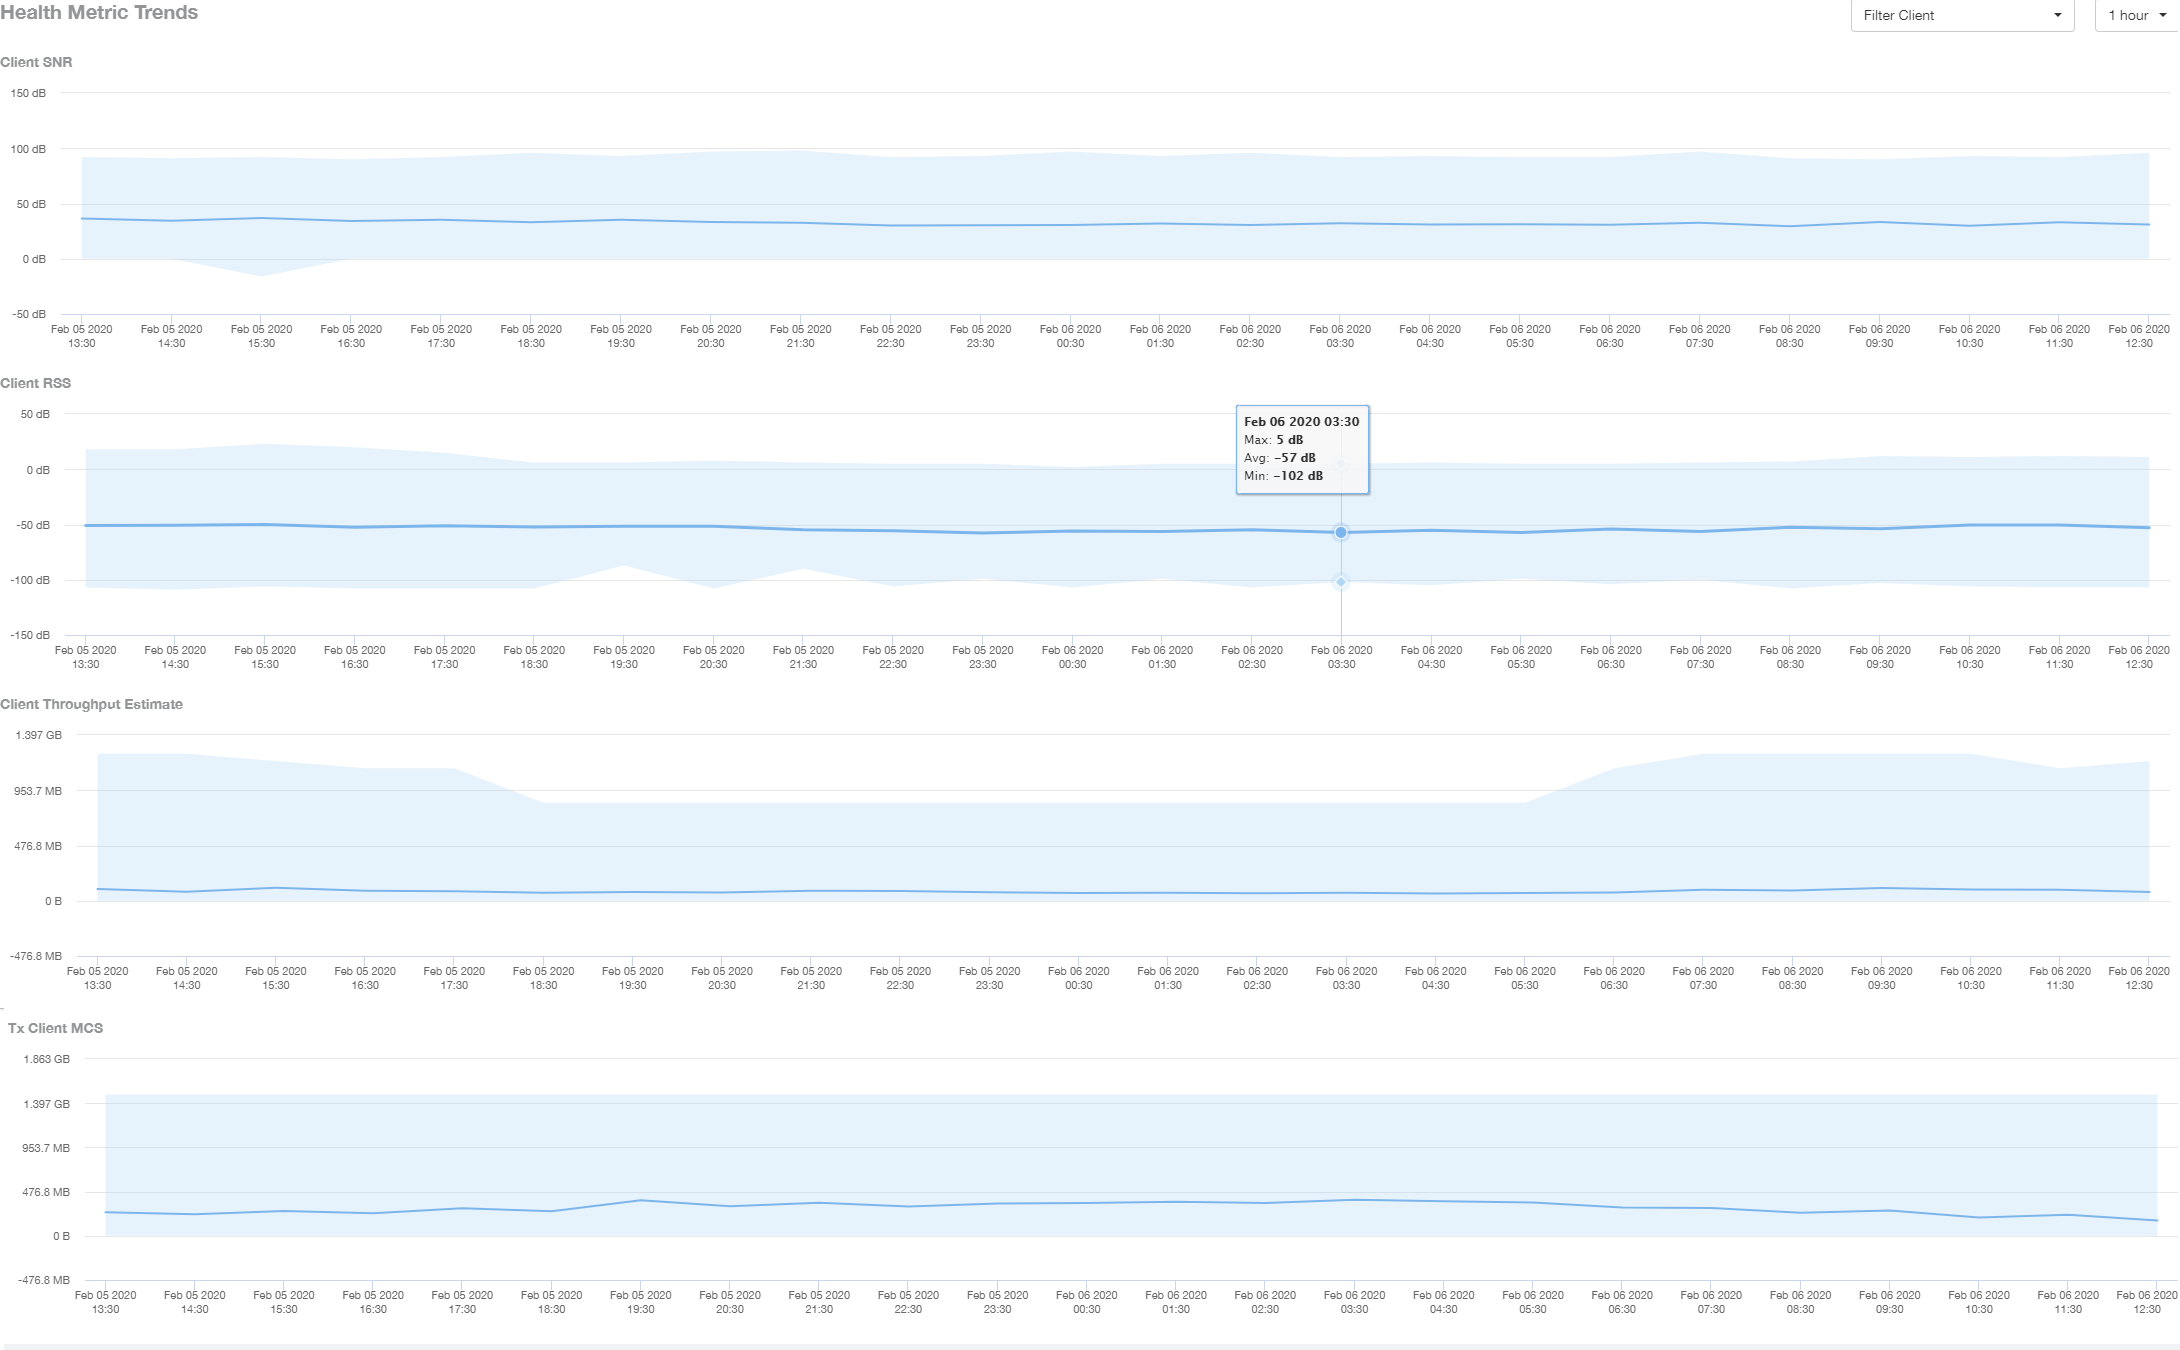
To understand the basis for the health score at a particular date and time, you can view the individual charts for RSSI, SNR, MCS (Tx) and client throughput, at the same date and time. This analysis identifies the raw metric that contributed to the health score computation.
All the four charts display the trends for all the clients that are connected. To view trends for specific clients, you can select the client from the Filter Client drop-down. By default, all clients are selected.