Switch Details Report
The Switch Details report provides details about one specific switch.
You can reach this report by either clicking on a hyperlink of a switch name from another dashboard, or by clicking Switch Details on the navigation bar. If you click Switch Details to get to this screen, you then need to enter the MAC address of the switch whose details you want to view.
The following figure shows only the upper sections of the Switch Details report:
- Summary tile
- Details tile
- Resource Utilization tile
- Top Ports By Traffic tile
- Traffic Trend tile
- LLDP Neighbor List tile
- Uptime History tile
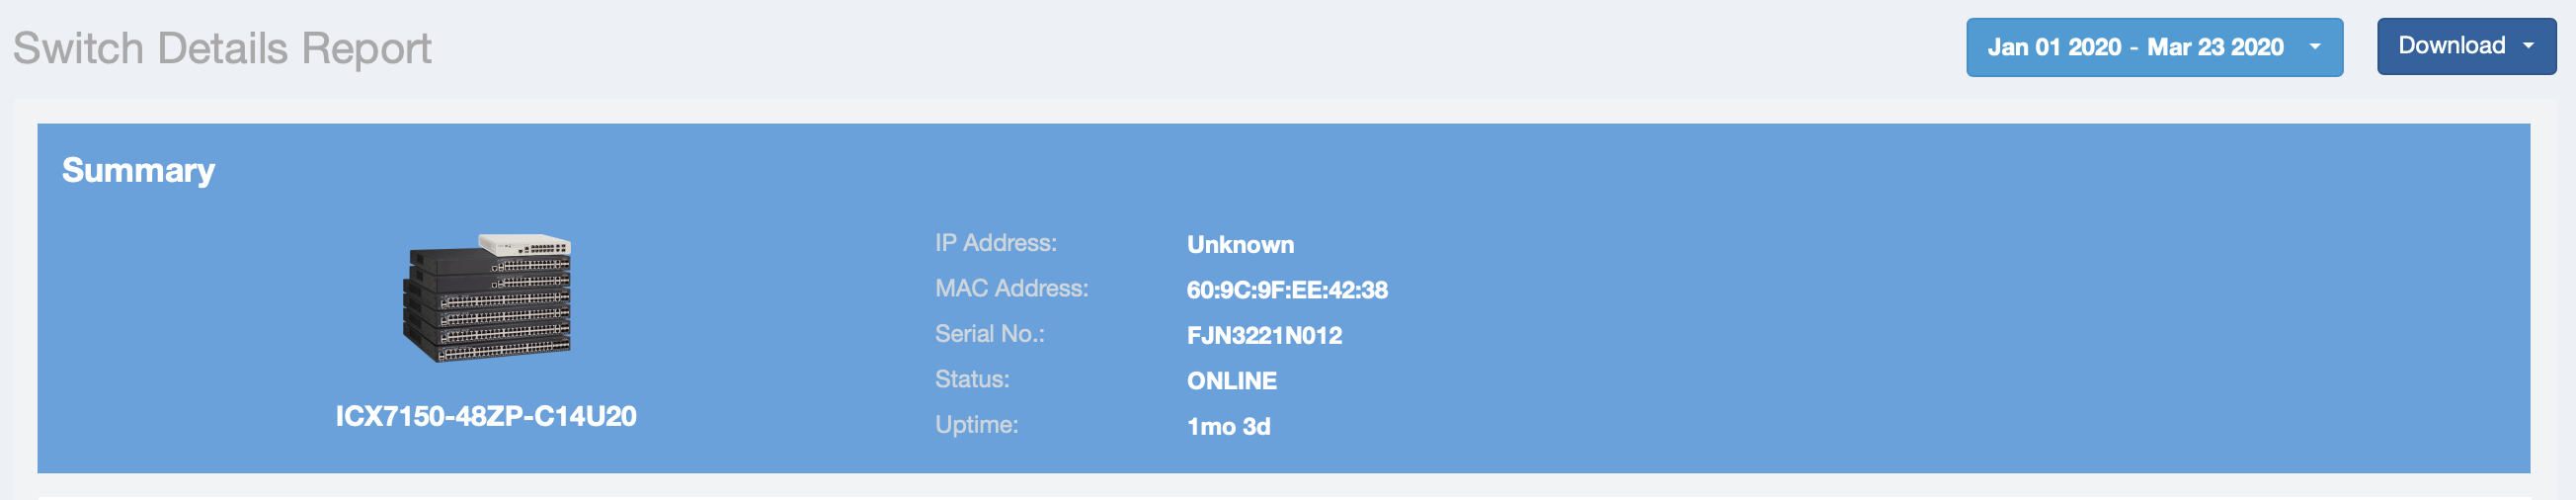
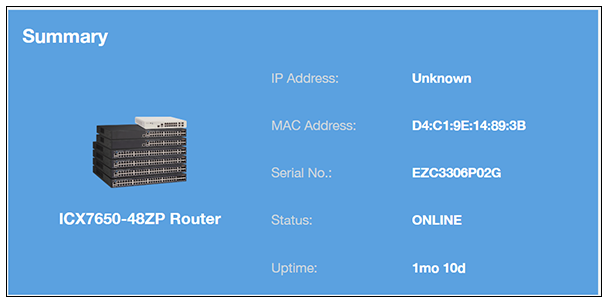
Summary Tile
The Summary section of the Switch Details report displays basic information about a specific switch.
The switch shown in this example is named ICX7650-48ZP Router.
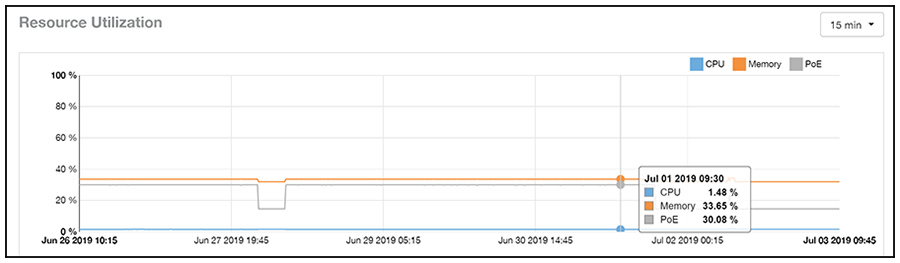
Resource Utilization Tile
The Resource Utilization table of the Switch Details Report displays the CPU, memory and disk utilization percentages for each switch in your system.
You can hover to view resource utilization at different times; you can toggle the boxes on and off to display or not display the data they represent.
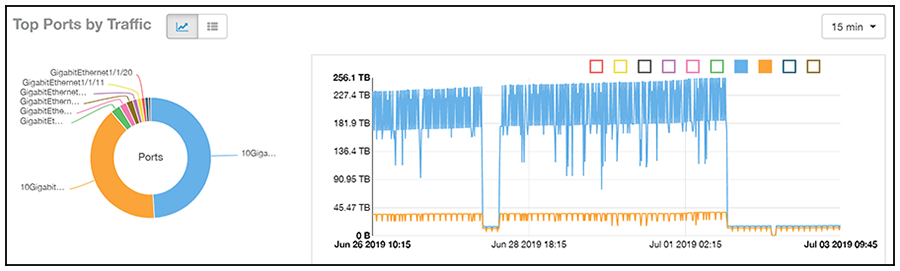
Top Ports By Traffic Tile
The Top Ports By Traffic pie chart and line graph of the Switch Details report depict the ports that have generated the largest volume of traffic over this switch for a specified period of time.
Use the drop-down menus to specify the time frame and the granularity of the graph. Click any of the colored squares to toggle display of the corresponding ports.
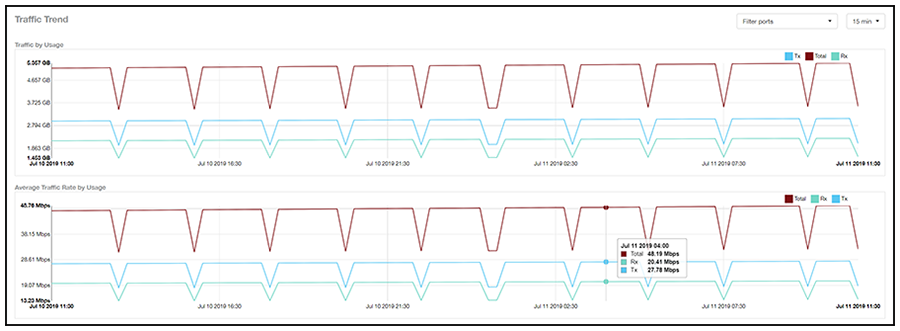
Traffic Trend Tile
The Traffic Trend section of the Switch Details report contains two line graphs that provide information about the specified switch: one that depicts traffic by usage, and one that shows the average traffic rate by usage.
You can hover over portions of the line graph to view different types of traffic at certain time intervals, and you can click any of the colored squares to toggle display of the corresponding type of traffic.
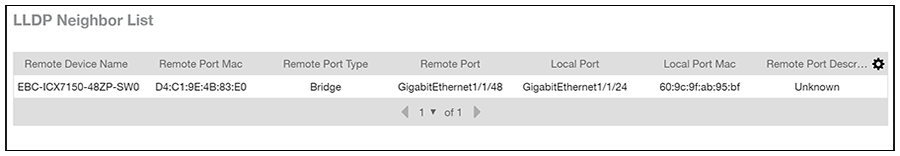
LLDP Neighbor List Tile
The LLDP Neighbor List table of the Switch Details report provides information about all the LLDP neighbors of the specified switch.
Click the gear icon
 to select the list of columns to display. The number of rows per page is defined by the
Rows per Page option in the table settings menu.
to select the list of columns to display. The number of rows per page is defined by the
Rows per Page option in the table settings menu.
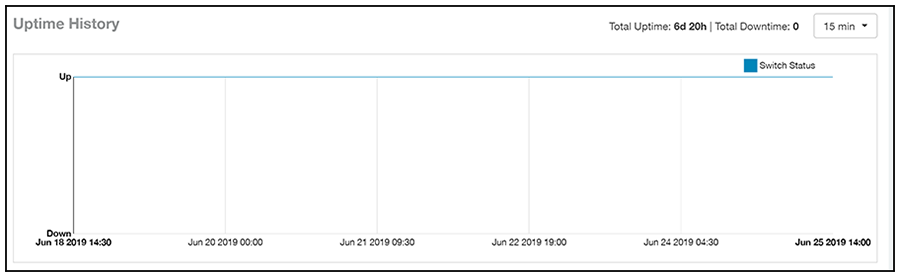
Uptime History Tile
The Uptime History line graph of the Switch Details report shows when this switch has been up or down over different time periods.
The blue bar indicates when the switch has been up or down. Use the drop-down menu to specify the timeframe and the granularity of the graph.