WLAN Report
The WLAN Report contains information about the added SSIDs, including which are active and which have been removed.
The report includes details about SSID changes over time, SSIDs by received and transmitted traffic, the client count over a time range, and the trend of the SSIDs based on traffic count and volume. The WLAN Report allows you to filter the information based on APs, SSID and radio, day and date, and receive and transmit (Rx+Tx) filters.
From the navigation bar, select Report > WLAN.
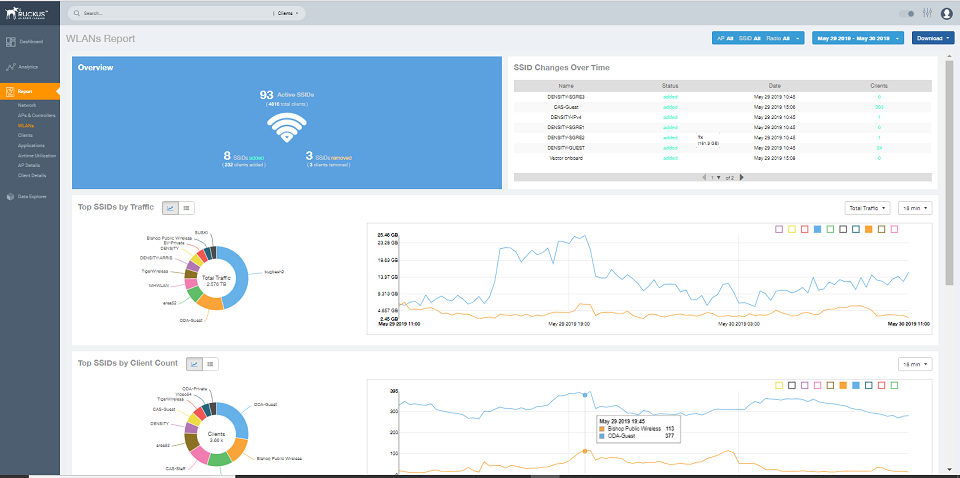
The WLANs Report consists of the following components:
Overview tile
SSID Changes Over Time table
Top 10 SSIDs by Traffic tile
Top 10 SSIDs by Client Count tile
Active SSIDs Trend graph
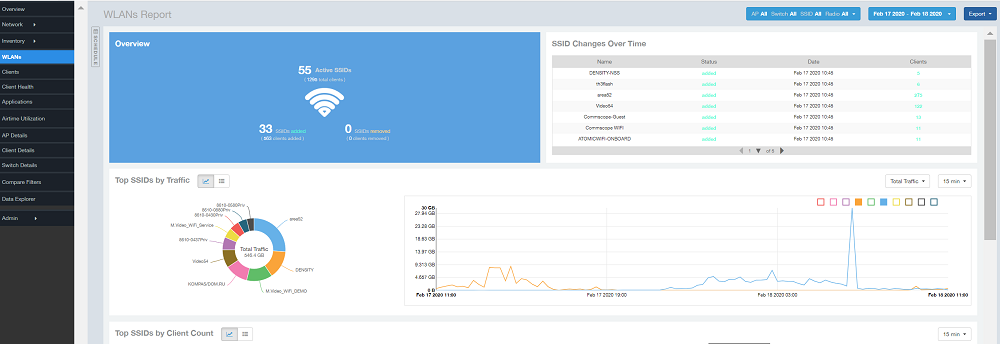
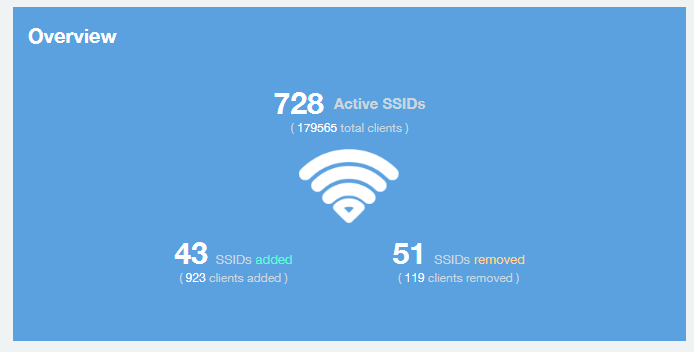
Overview Tile
The Overview tile of the WLAN Report shows the total number of active SSIDs, and the number of added and removed SSIDs over the selected period.
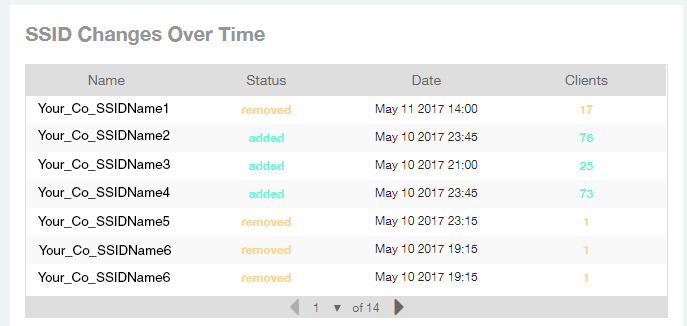
SSID Changes Over Time Tile
The SSID Changes Over Time table display of the WLAN Report shows the most recent SSID changes.
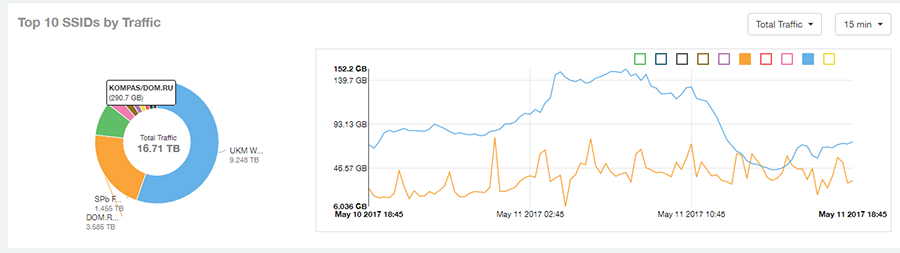
Top SSIDs by Traffic Table
Use the Top SSIDs by Traffic donut pie chart and graph of the WLANs Report to view which wireless networks are generating the most traffic, to compare usage of the top WLANs over different time periods, and to compare Tx and Rx statistics independently.
The Top SSIDs by Traffic tile contains a donut chart and a graph.
In the graph, click any of the colored squares to display the corresponding SSID details in the line graph. You can use the traffic menu to choose whether to display transmitted data only, received data only, or total traffic data.
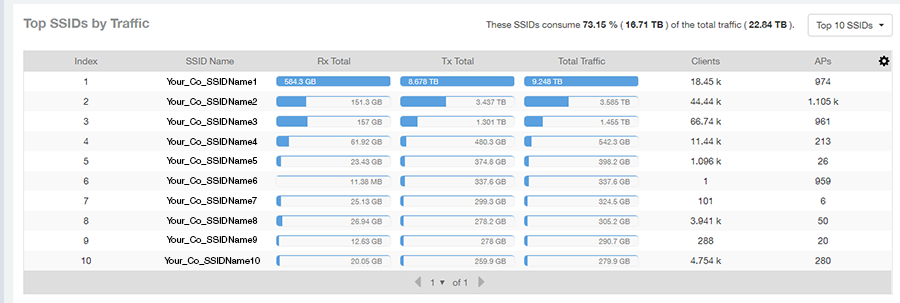
Use the chart and table icons ( ) to toggle between the chart and table views.
In the
Top SSIDs by Traffic table, you can sort the table by total traffic, clients, AP count, or alphabetically by SSID name. Click the gear icon ( ) to select the columns to display, and click any column heading to sort the table by that column. The number of rows in a page is defined by the
Rows per Page option in the table settings menu.
) to select the columns to display, and click any column heading to sort the table by that column. The number of rows in a page is defined by the
Rows per Page option in the table settings menu.
You can select the top 10 (default), 20, 50, or 100 SSIDs by traffic volume, or list all SSIDs.
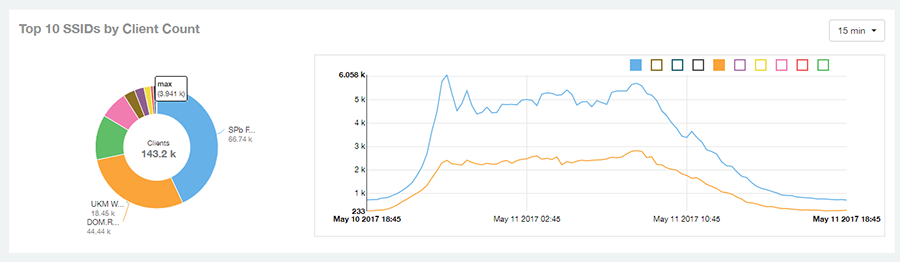
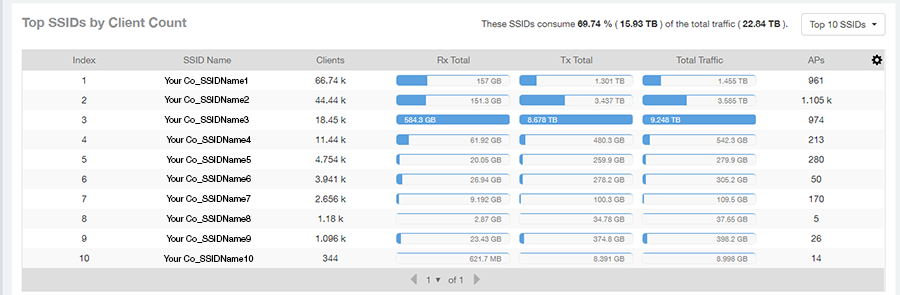
Top SSIDs by Client Count Tile
Use the Top SSIDs by Client Count donut chart and graph of the WLAN Report to view which wireless networks are most congested in terms of client count, and to compare client counts over different time periods.
The Top SSIDs by Client Count tile contains a donut chart and a graph.
In the graph, click any of the colored squares to display the corresponding SSID details in the line graph.
If you pause a pointer over the line graph, an information box is displayed containing the selected SSID names and client counts at the chosen data point.
Use the chart and table icons () to toggle between the chart and table views.
In the
Top SSIDs by Client Count table, you can sort the table by total traffic, clients, AP count, or alphabetically by SSID name. Click the gear icon () to select the columns to display, and click any column heading to sort the table by that column. The number of rows in a page is defined by the
Rows per Page option in the table settings menu.
You can select the top 10 (default), 20, 50, or 100 SSIDs by client count, or list all SSIDs.
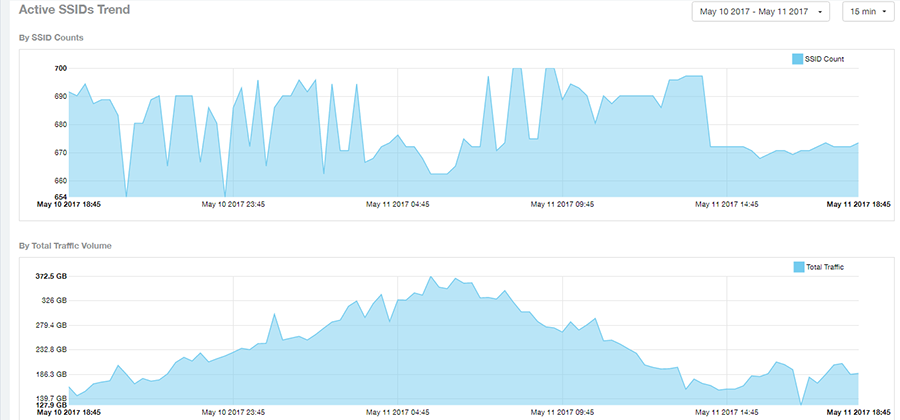
Active SSIDs Trend Graphs
The Active SSIDs Trend graphs of the WLAN Report show the: total number of SSIDs over time, and the total traffic volume over time.
Delete this line here. A repeat of the opening paragraph.
Pause the pointer over the graphs to display the total SSID count or total traffic volume at any specific data point.