Accessing and Viewing Intent Details
The Intent Details page provides a detailed report of the intent. While the layout of the Intent Details remains consistent across different AI-feature intents, the information displayed varies depending on the specific AI-feature intent and its current status. The content adapts to reflect the key metrics and insights relevant to each AI-feature intent.
- From the navigation bar, click . The IntentAI page is displayed.
- In the IntentAI table, click on the AI feature name which has a status other than New to view its associated intent details. The Intent Details page is displayed.
- Information tile
- Details tile
- Interfering Links tab
- Neighbor AP Graph tab
- Channel Distribution tile
- Power Transmission tile
- Benefits tile
- Potential trade-off tile
- Status Trail tile
Information Tile
The Information tile displays the name of the AI feature, its corresponding intent, and a brief description of the scope of the selected intent priority. It also shows the selected intent priority, category, venue, user details and date and time of the most recent status change of the intent and the next schedule.
The RRM comparison button (which is available exclusively for AI-Driven RRM intent) allows you to download a comparison report in .csv format. This report outlines the specific changes proposed for each AP, highlighting adjustments in channel, bandwidth, and power settings. It provides a side-by-side comparison of the 'before' and 'after' configurations.
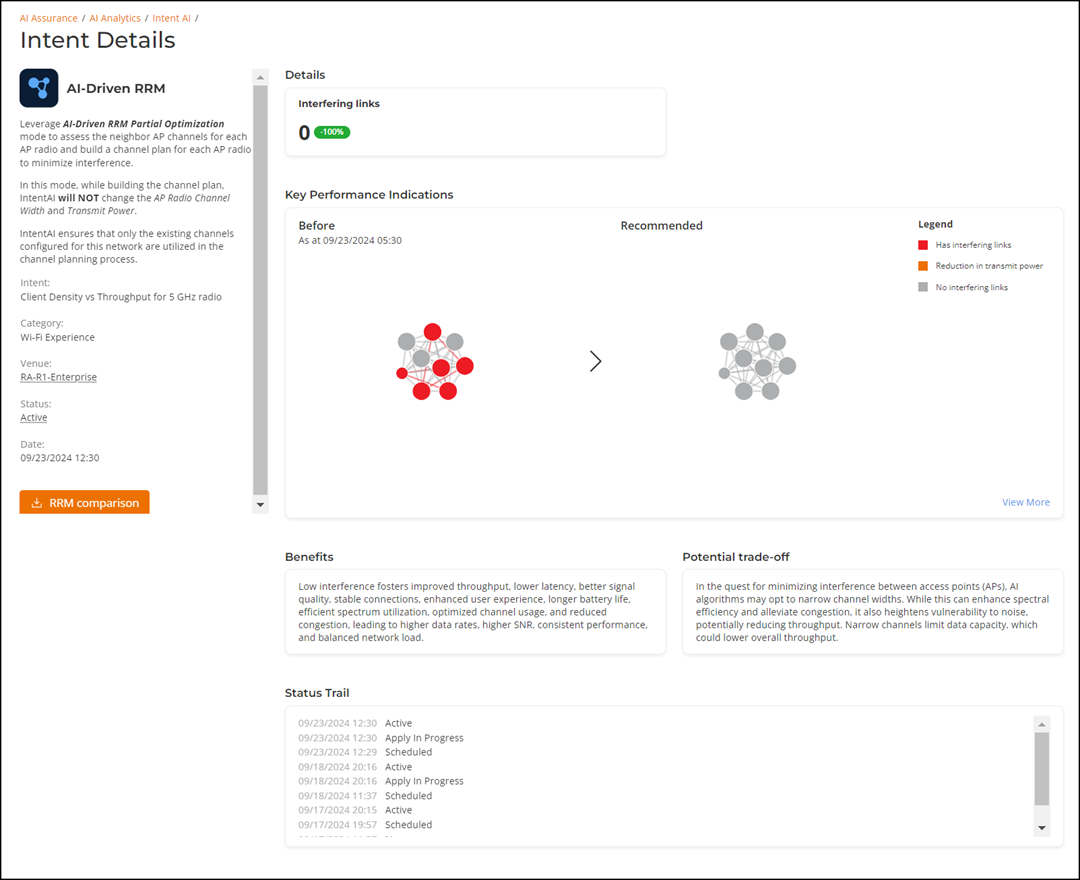
Details Tile
The Details tile provides a comprehensive view of key configurations and performance metrics, which vary based on the AI-feature intent and its current status. It displays the original configuration, the current configuration, or any recommended configuration when new recommendations are available. For a new intent, the tile shows the current KPI or configuration along with a forecasted KPI or chart, if available.
Interfering Links Tab
The Interfering Links tab displays a comparative graph that shows the current configuration, including the number of interfering links discovered in a venue and the expected state after applying the recommended AI-Driven RRM Intent. This graph highlights how APs with interfering links in the current state can, after applying the recommended Intent, transition to a state with reduced interfering links, showcasing a before-and-after improvement in the RF environment. It helps to understand how the recommended Intent reduces co-channel interference and balances RF conditions. Click View More to view the interactive graph with granular details and zoom in or zoom out capability; pausing your cursor over any dot will bring up a side-by-side example that further identifies specific APs as well as the proposed changes.
Neighbor AP Graph Tab
The Neighbor AP Graph tab displays a comparative view of the average metrics for neighboring APs in the current state and the expected state after applying the recommended AI-Driven RRM Intent. These metrics include co-channel interfering APs that can cause signal interference and degrade network performance, non-interfering APs that operate on different channels, and rogue APs that may pose security risks or act as interference sources. This data helps to assess RF congestion, plan channels proactively, mitigate interference, and enforce wireless security policies. Click View More to access a detailed expanded view of the graph.
Channel Distribution Tile
The Channel Distribution histogram displays Wi-Fi channel allocation across all APs in the network. It helps visualize the spread and density of channel usage, enabling identification of channel crowding, overlapping usage, or imbalances in channel planning. This insight supports more effective channel allocation, reducing interference, and maximizing overall network efficiency.
Power Transmission Tile
The Power Transmission histogram displays the distribution of transmit power levels configured across APs. It reflects how much RF power APs are using to communicate with clients highlighting uneven or suboptimal power settings - either too high, causing interference, or too low, leading to coverage gaps. This insight helps to fine-tune RF performance for consistent and reliable connectivity across the deployment.
Benefits Tile
The Benefits tile highlights the advantages gained from applying the selected intent. It outlines improvements such as enhanced performance, optimized resource utilization, increased efficiency, and better overall system stability. These benefits contribute to achieving the desired network goals, improving user experience, and reducing operational overhead.
Potential trade-off Tile
The Potential trade-off tile outlines the key considerations the administrator should be aware of before applying the recommendation.
It describes the scope of venue-level configuration changes that will be applied and the potential impact on the network after applying the recommendation.
Status Trail Tile
The Status Trail tile provides a log of all actions performed by the intent, offering a detailed history of activity. It includes timestamps for each status change, allowing you to track the date and time of every update.