Viewing Events
An event in RUCKUS One represents any significant activity occurring on managed access points (APs), switches, associated clients, or within the system. Events help tenants identify issues requiring immediate action, as well as informational conditions that may assist with monitoring or troubleshooting. The Events page allows you to view, sort, filter, and download details of all events generated within your RUCKUS One account during the selected time window.
-
On the navigation bar, select
.
The Events page is displayed.
Timeline - Events 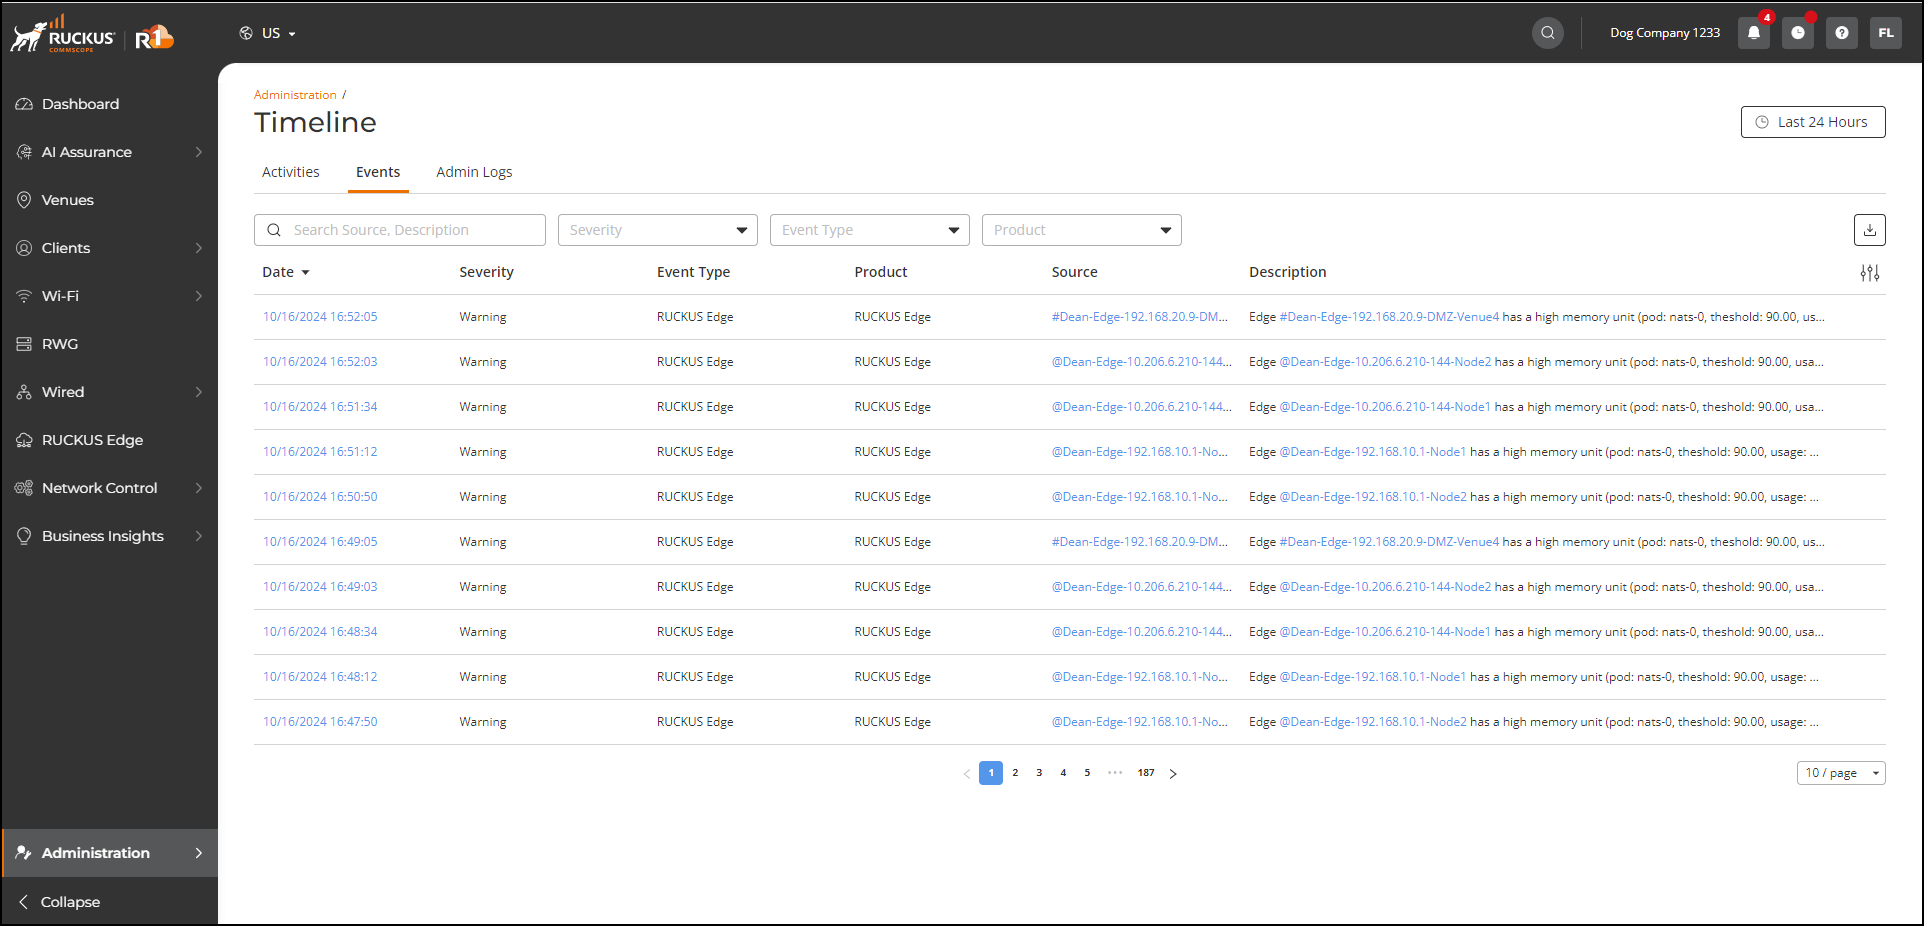
-
Review the following information
for each event displayed in the table:
- Date: Displays the date and time (as a hyperlink) when the event occurred. Click the hyperlink to view the event details in the Event Details sidebar.
- Severity: Displays the severity of the event (Critical, Major, Minor, Warning, or Informational). Refer to Event Severity Levels for more information.
- Event Type: Displays the category of the event. Refer to Event Types for more information.
- Product: Displays the product category related to the event.
- Source: Displays the name of the AP, switch, client, or system entity (as a hyperlink) that generated the event. Click the hyperlink to access the corresponding details page.
- MAC Address: Displays the MAC address of the device, if applicable. This field may be blank for events that are not device-specific.
- Description: Displays a brief description of the event. Descriptions include dynamic details such as the service network name, device name or client MAC address to assist with troubleshooting. When applicable, identifiers are displayed as hyperlinks that you can click to view related details.
For R770 APs running firmware version 7.0.0.104.1274 or later, load‑balancing and client‑steering activity generates additional event entries, including:- Client BTM Request Sent: This event is logged when an AP attempts to steer a client to a neighboring AP for load balancing or sticky client steering.
- Client BTM Response Received: This event is logged when the AP receives a BSS Transition Management (BTM) response from a client that it previously attempted to steer to a neighboring AP for load balancing or sticky client steering.
- Client Disassoc
by CLB: This event is logged when the AP
disassociates a client due to a load‑balancing or sticky
client‑steering operation. This event occurs when a disassociation
request is sent to a non‑11v‑capable client to move the client to a
better AP.
Events - Load Balancing and Sticky Client Steering Events 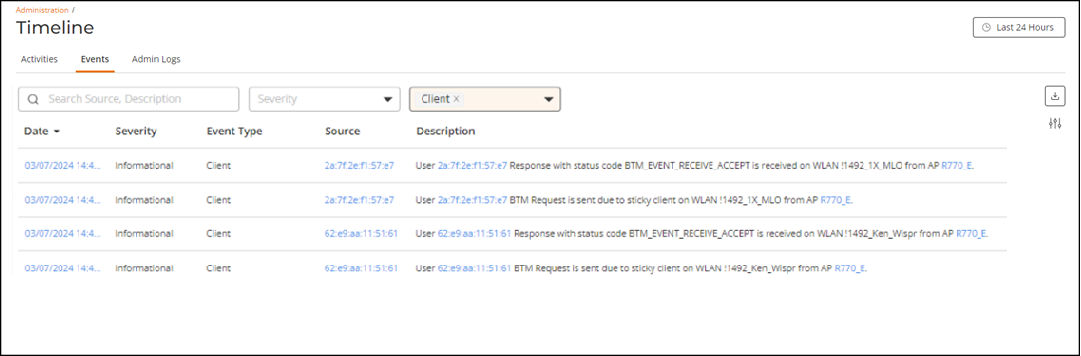
You can customize which fields appear in the table by clicking the
 icon and selecting or deselecting the desired column names. Optionally,
you can click Reset to default to restore the default subset of columns.
Click Clear
Filters to remove all applied filters and restore the
complete list of events. You can sort the list by clicking the associated
column header.
icon and selecting or deselecting the desired column names. Optionally,
you can click Reset to default to restore the default subset of columns.
Click Clear
Filters to remove all applied filters and restore the
complete list of events. You can sort the list by clicking the associated
column header. You can use the Search field to display only table entries that match the specified Source or Description; enter a minimum of two characters. Additionally, you can refine the list of events by selecting options from the Severity, Event Type, and Product drop‑down lists. The severity filter options are Critical, Major, Minor, Warning, and Informational. The event type filter includes Security, Client, Switch, Network, RUCKUS Edge, IoT Controller, Profile, and Optical. The product filter includes General, Wi‑Fi, Switch, RUCKUS Edge, IoT Controller, and Optical.
-
(Optional) Click the
 icon to reload the latest events.
-
(Optional) Click the
 icon to export the displayed events as a .csv file for offline
analysis.
icon to export the displayed events as a .csv file for offline
analysis.