Wireless Client Insights
The Wireless Client Insights page provides detailed, time-range-based analytics for the selected client, including traffic usage, application distribution, RF performance trends, and session details.
- On the navigation bar, select . The Wireless Clients List page is displayed.
- Click Hostname attribute of the required client. The Wireless Client Troubleshooting and Insights page is displayed.
- Click Insights. The Wireless Client Insights page is displayed.
- Overview tile
- User Traffic by Radio tile
- Top Applications by Traffic tile
- Traffic Trend Tile
- RSS Trend tile
- SNR Trend tile
- Sessions table
The data displayed on this page is based on the selected date and time range. Use the Date and Time filter in the upper-right corner to select a predefined time range or configure a custom date and time range. For more information, refer to Content Panel.
Some of the tiles have the option to view the report in graphs and tables. The Graph and Table icons are displayed on top of the applicable tiles. By default, in those tiles, the reports are displayed in graphical format. If you want to view the report in table format, click the Table icon.
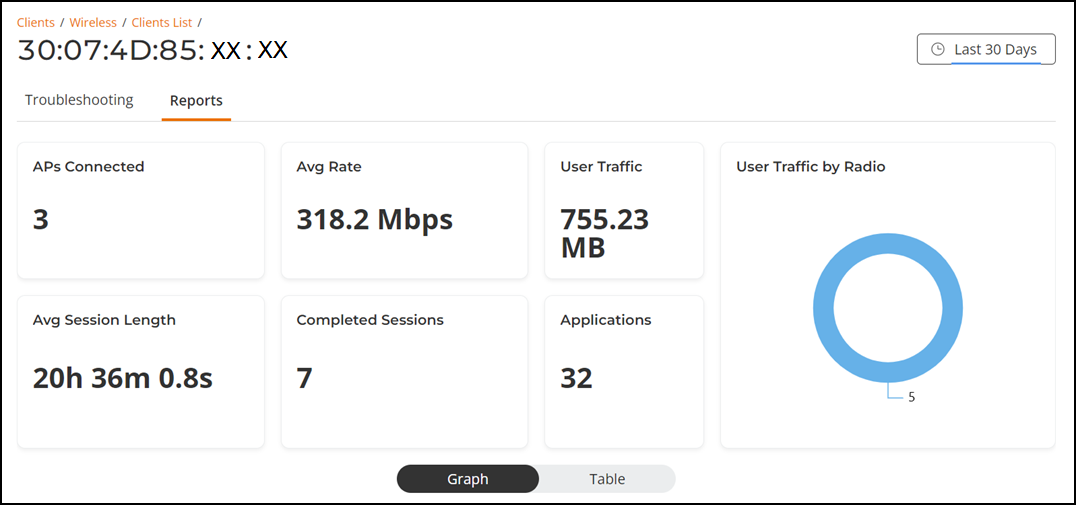
Overview Tile
The Overview tile provides a general overview of the selected client and displays the count of total APs connected, client throughput, user traffic, average session length, completed sessions, and applications for the selected time period in the Date and Time filter.
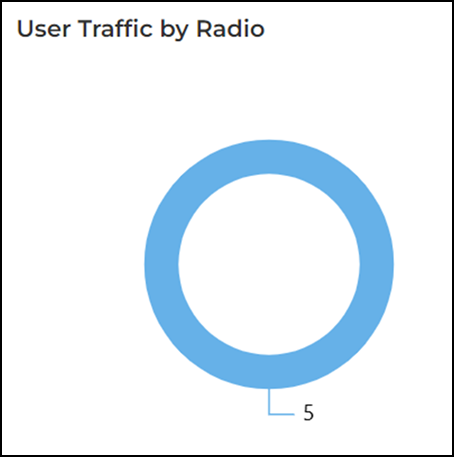
User Traffic by Radio Tile
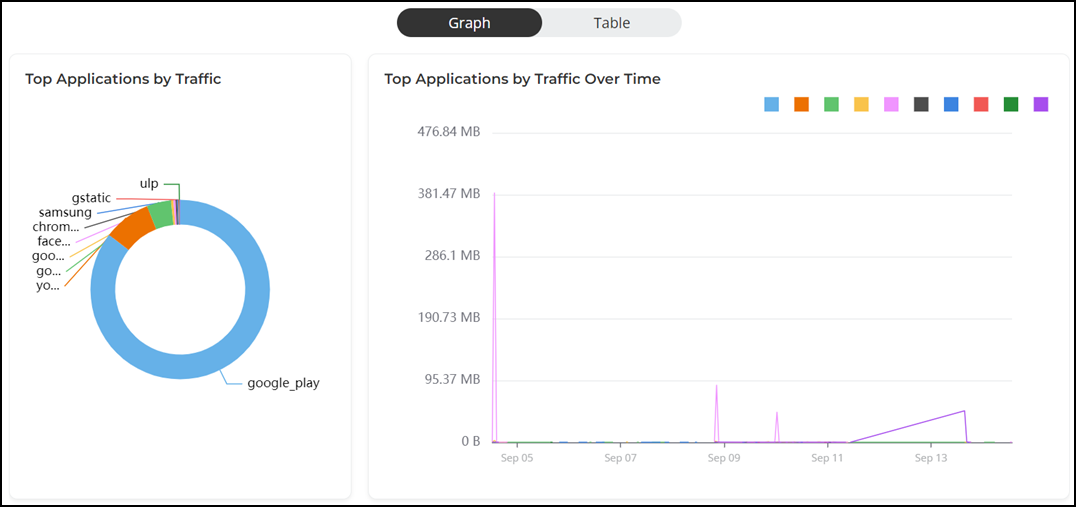
Top Applications by Traffic Tile
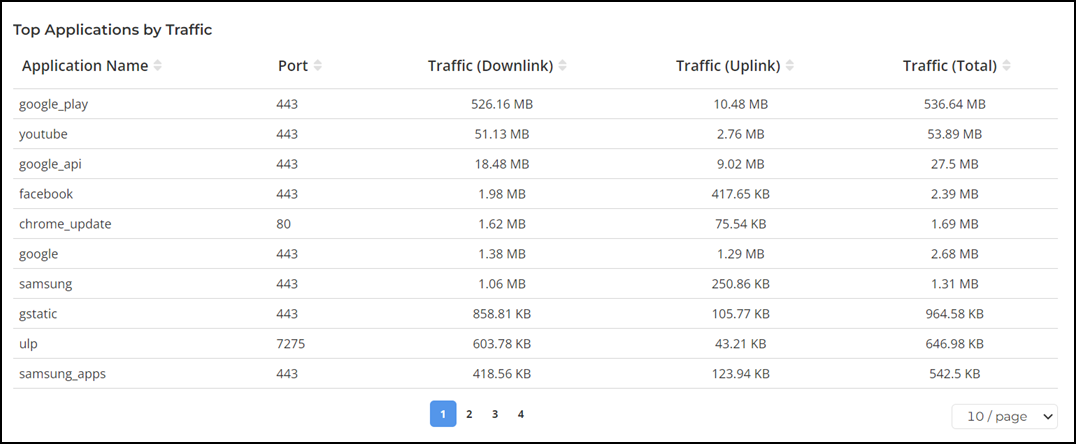
The Top Applications by Traffic tile contains two panes Top Applications by Traffic and Top Applications by Traffic Over Time.
The Top Applications by Traffic pane displays a donut chart. The donut chart display the top applications with the largest traffic in the AP, along with the received and transmitted traffic for the selected time period in the Date and Time filter. Pausing the pointer over the chart displays an information box with the details of the selected application.
The Top Applications by Traffic Over Time pane displays a graph. The graph display the top applications with the largest traffic in the AP, along with the received and transmitted traffic for the selected time period in the Date and Time filter. Pausing the pointer over the graph displays an information box with the details of the application at that time and date. Click any of the colored squares to hide the selected application in the graph. The information icon that is hidden is displayed in gray.
To view all the applications, click Table icon. The table is displayed with the application name, port, downlink traffic, uplink traffic, and total traffic for the selected time period in the Date and Time filter.
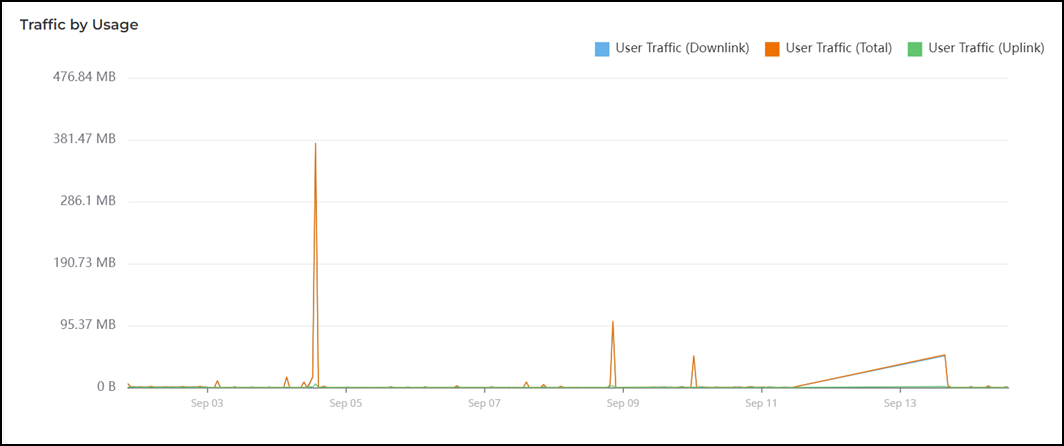
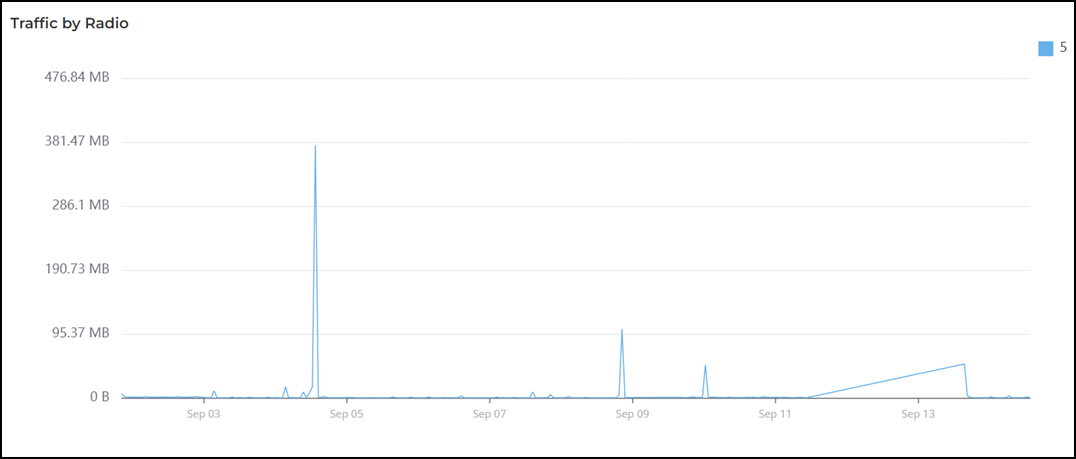
Traffic Trend Tile
- Traffic by Usage tile
- Traffic by Radio tile
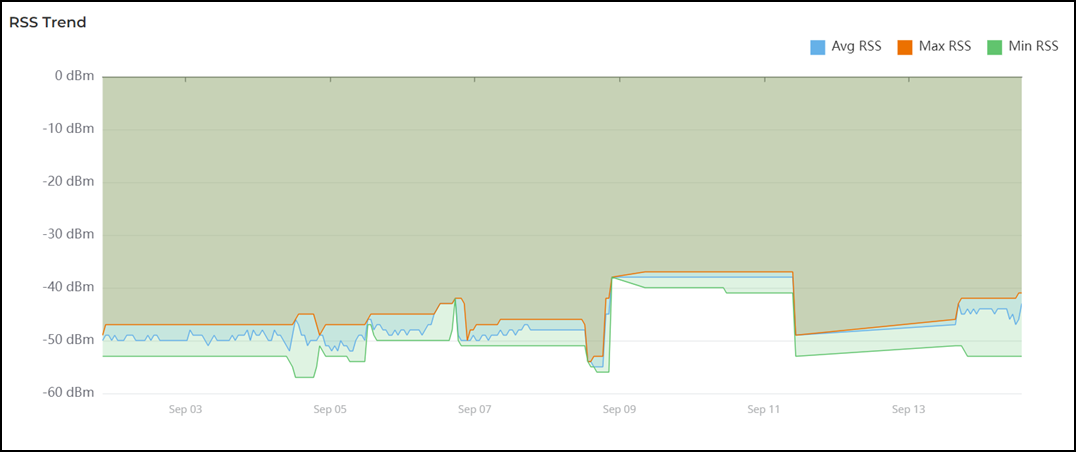
RSS Trend Tile
The RSS Trend tile contains a graph that displays the received signal strength trends over time for the selected client AP. This data is displayed only for the selected time period in the Date and Time filter. Pausing the pointer over the graph displays an information box with the RSS details at that time and date. Click any of the colored squares to hide the selected RSS details in the graph. The information icon that is hidden is displayed in gray.
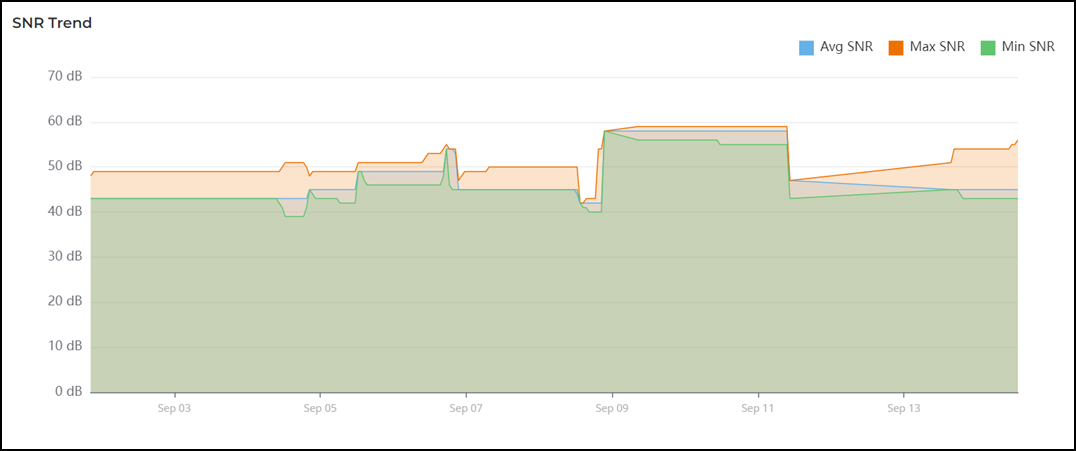
SNR Trend Tile
The SNR Trend tile contains a graph that displays the signal-to-noise ratio over time for selected client AP. This data is displayed only for the selected time period in the Date and Time filter. Pausing the pointer over the graph displays an information box with the SNR details at that time and date. Click any of the colored squares to hide the selected SNR details in the graph. The information icon that is hidden is displayed in gray.
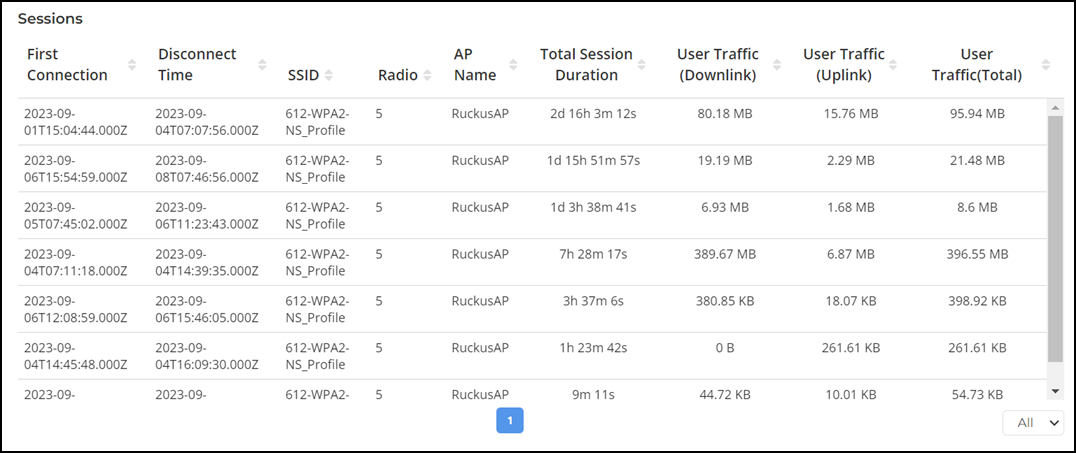
Sessions Table
The Sessions table displays information on the number of client sessions specified for the selected client AP between time periods. This data is displayed only for the selected time period in the Date and Time filter. The table displays attributes such as first connection, disconnection time, session duration, host name, SSID, radio, inbound user (Rx), outbound user (Tx), and user traffic.