Wireless Client Troubleshooting
The Wireless Client Troubleshooting page displays connection events, roaming activity, connection quality metrics, network incidents, and event history to help analyze and diagnose client connectivity issues.
- From the navigation bar, select . The Wireless Clients List page is displayed.
- Click Hostname attribute of the required client. The Wireless Client Troubleshooting and Insights page is displayed. By default, the Wireless Client Troubleshooting page is displayed.
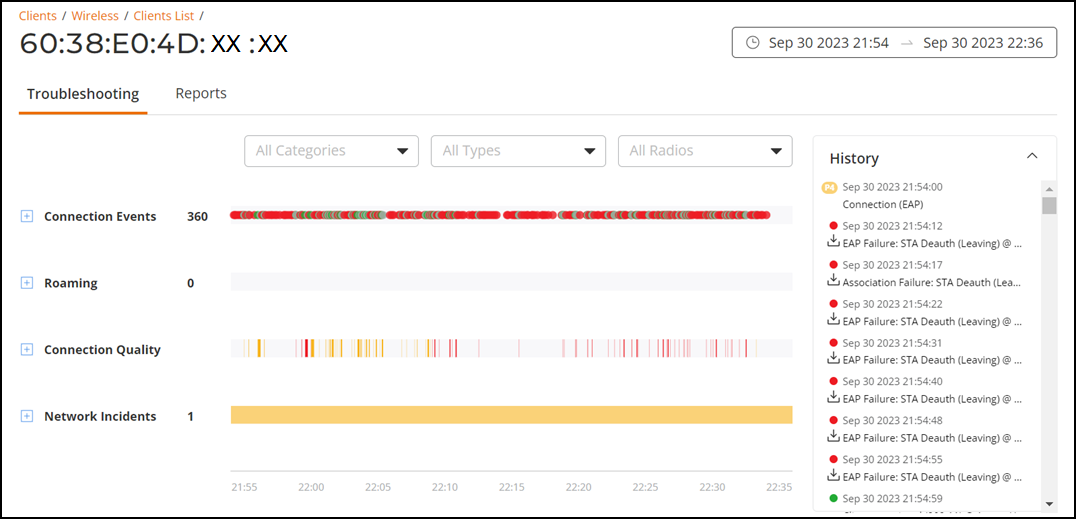
- Connection Events tile
- Roaming tile
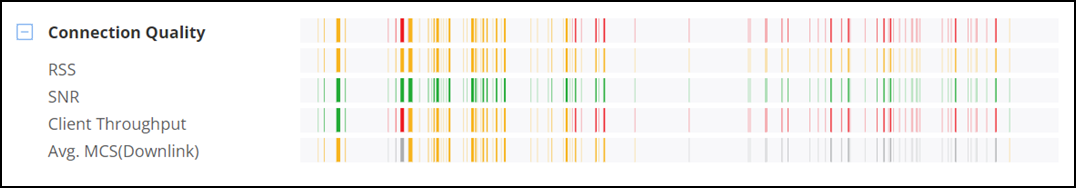
- Connection Quality tile
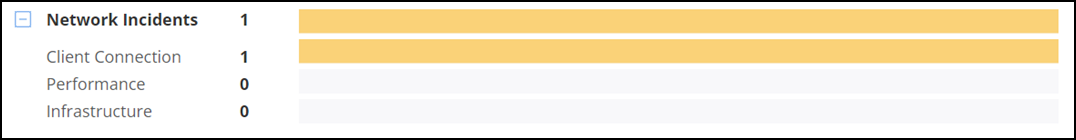
- Network Incidents tile
- History tile
The data displayed on this page is based on the selected date and time range. Use the Date and Time filter in the upper-right corner to select a predefined time range or configure a custom date and time range. For more information, refer to Content Panel.
To improve performance, only the most recent set of events within the selected time range is shown, with older events truncated. To view events outside this window, adjust the date and time range accordingly.
You can also use the search field to filter the troubleshooting information based on the search criteria, such as categories, types, and radio bands.
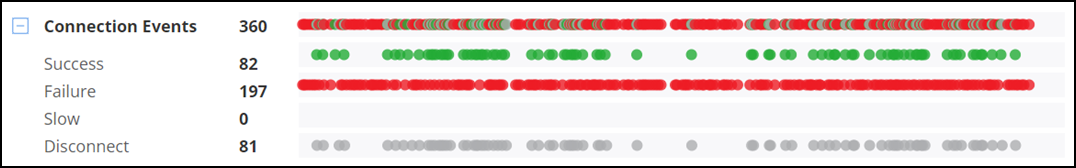
Connection Events Tile
- Green: Successful connection. Pause the pointer over the green dots to view more information such as the AP MAC address, AP name, SSID and Radio.
- Red: Failed
connection. You can also click the red circle to view the time of the
failure scenario (for example, whether the failure occurred during the EAP
request, DHCP discovery, and so on). Pausing the pointer over the circle
provides a quick snapshot of information such as the exact time of failure,
the type of failure, the client IP address, connection diagram analyzing the
point of failure and so on. The failed path is denoted by a red arrow, as
shown in the figure.
Failed Event Path 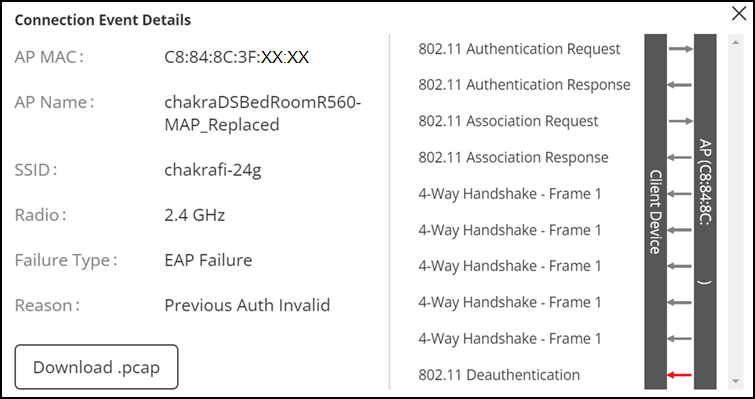
- Yellow: Slow (long time to connect to connection).
- Gray: Disconnected.
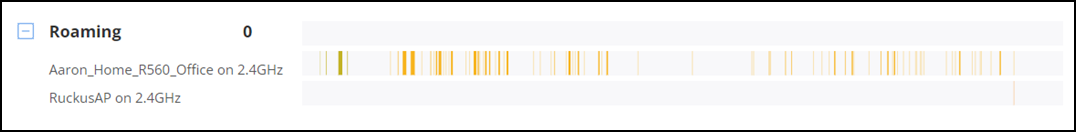
Roaming Tile
- Green: Successful roam.
- Red: Failed connection.
- Yellow: Slow (long time to connect to connection).
- Gray: Disconnected.
Connection Quality Tile
- Green: Good
- Red: Poor
- Yellow: Average
Network Incidents Tile
- Red: P1
- Dark Orange: P2
- Orange: P3
- Yellow: P4
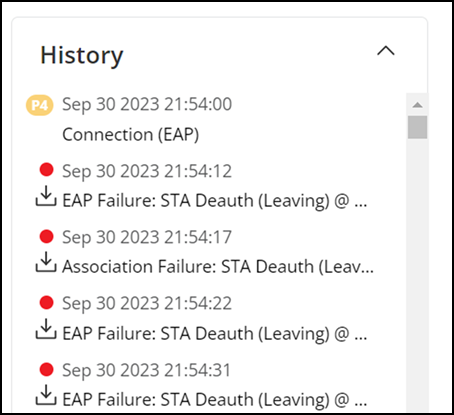
History Tile
The History tile displays the history of events that occurred for this client, along with the severity, date and time of the events, event status, and failure events PCAP report. The data displayed is for the selected time period in the Date and Time filter. It shows the client connected and disconnected events, the network incidents, and so on. Clicking on any network incident in the History tile directs you to the Incident Details page. For more information on the Incident Details page, refer to Incident Details.
Packet Capture (PCAP)
This is a collection of packets generated for all failure events with respect to the specific client. This allows the clients admins to inspect network packets and troubleshoot the issues. All PCAP reports will be stored for three months before they are deleted.
- On the navigation bar, select . The Wireless Clients List page is displayed.
- Click Hostname attribute of the required client. The Wireless Client Troubleshooting and Insights page is displayed. By default, the Wireless Client Troubleshooting page is displayed.
- In the History tile, click failure event (red circle).
The Connection Event Details dialog box is
displayed.
Connection Event Details Dialog Box
- Click Download .pcap icon to download the zip file.