Health
The Health page provides insights about key performance indicators of the network. The information provided in this page allows you to analyze historical network health and behavior.
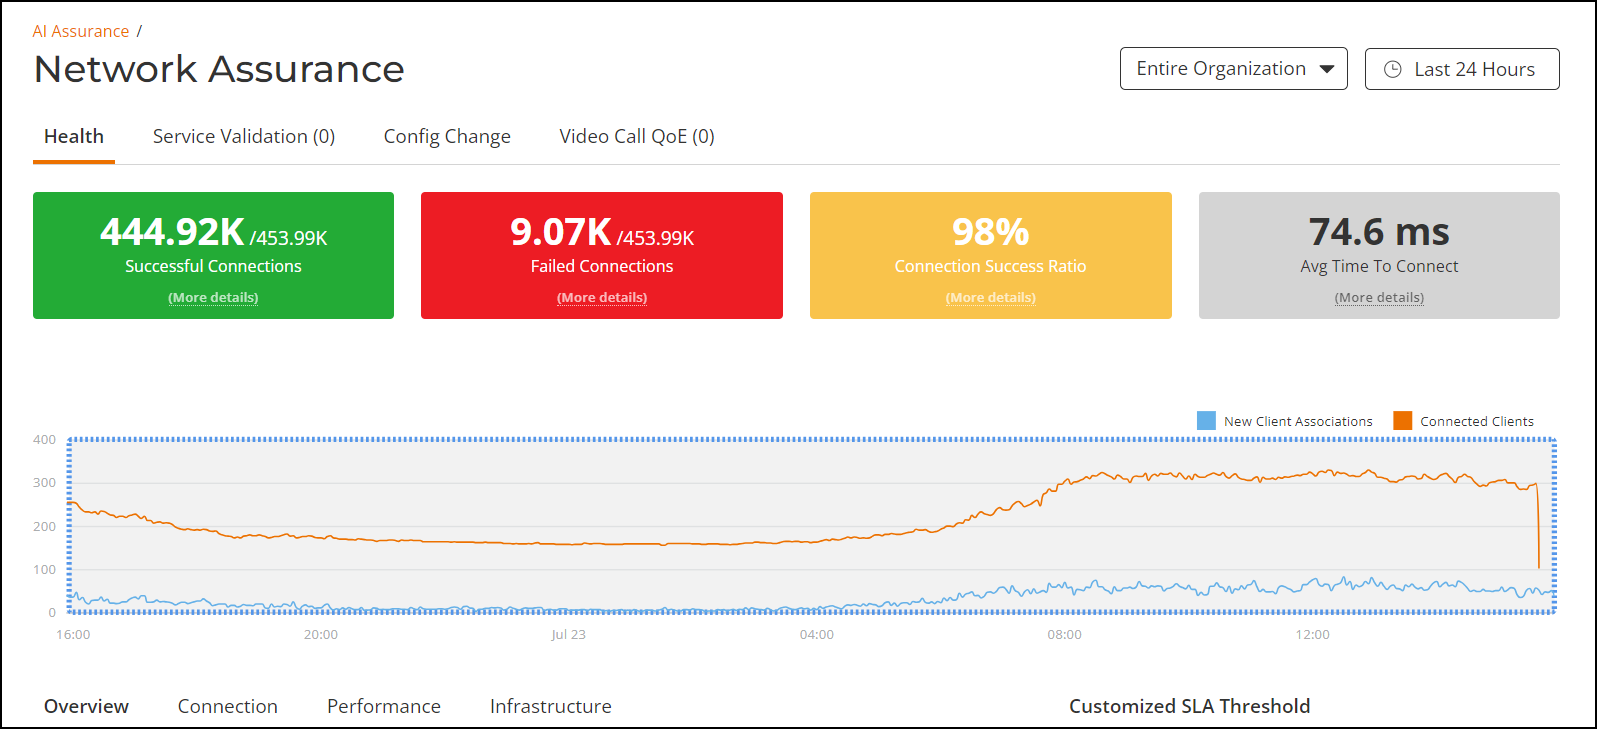
At a high level, the Health page displays the number of connection attempts, successful connections, failed connections, the connection success ratio, and the average time to connect. Clicking the More details link within each of the colored tile opens the associated Connection Failures sidebar.
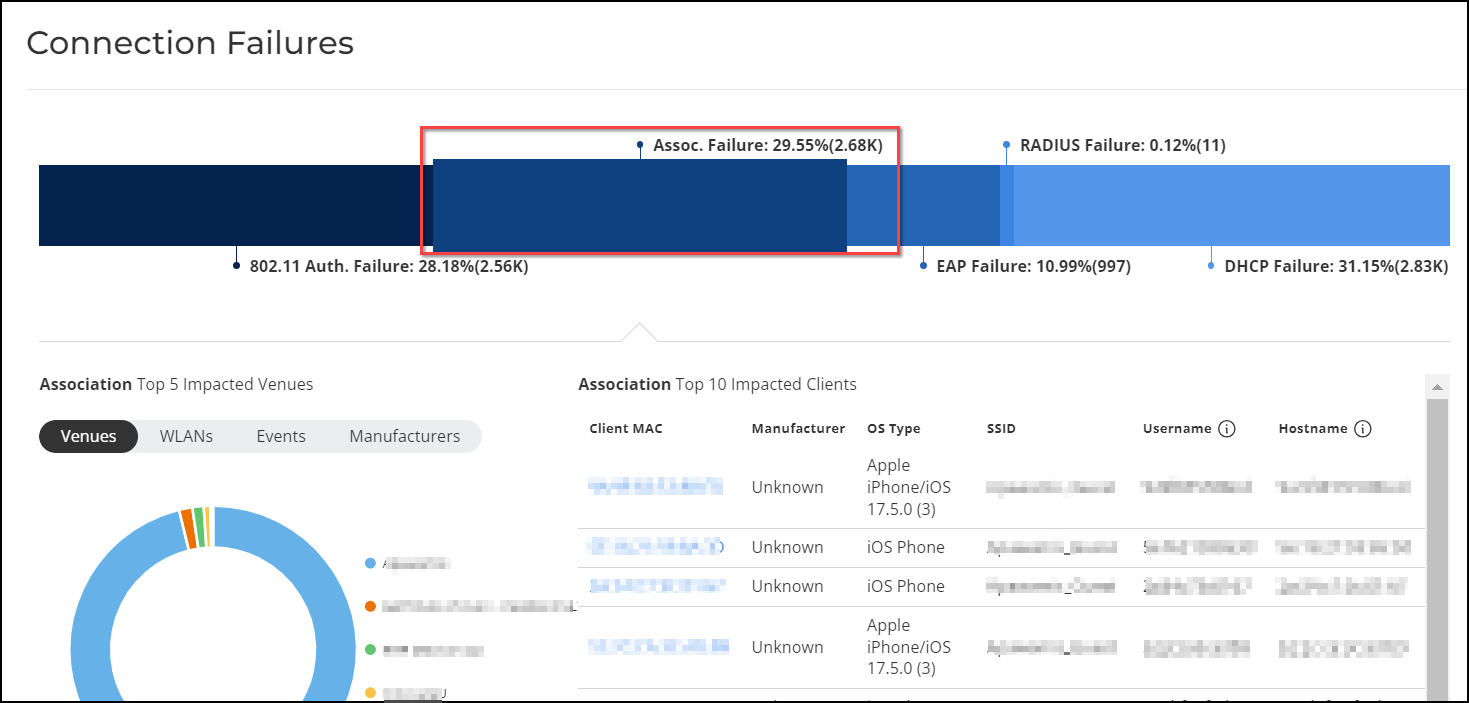
In the Connection Failures sidebar, click the connection failure type in the horizontal graph to display a pie chart and a table that offer top impacted clients and venues for that failure type. Clicking the client’s MAC address redirects you to the Troubleshooting page for that specific client for further analysis.
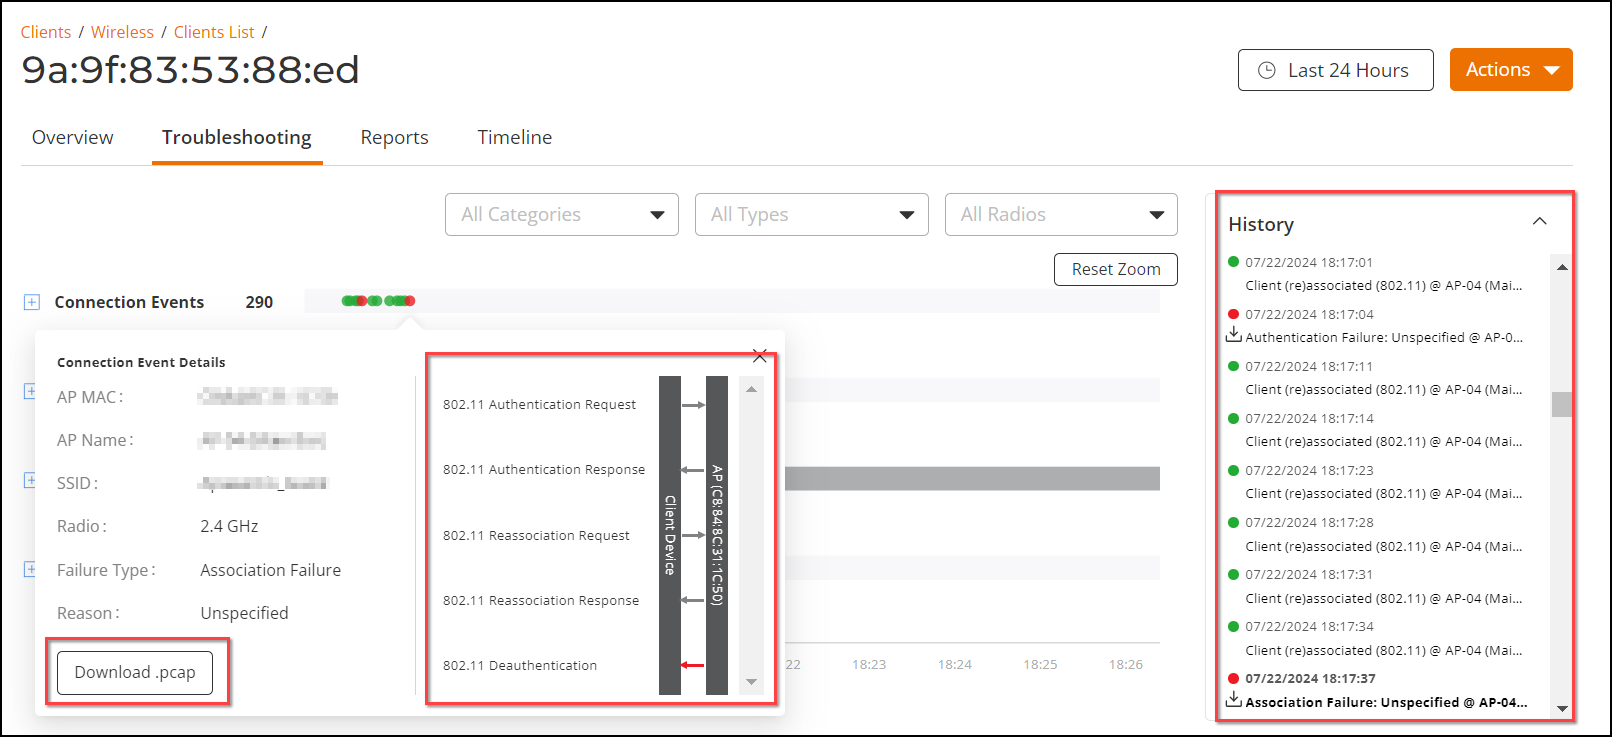
In the client’s Troubleshooting page, note the Download pcap option that appears when hovering your pointer over a red dot in the Connection Events row. Use this option to download a packet capture of the event.The packet capture is a great troubleshooting tool, along with the packet exchange scheme explaining the failure within the AP-to-client packet exchange process, and the History details.
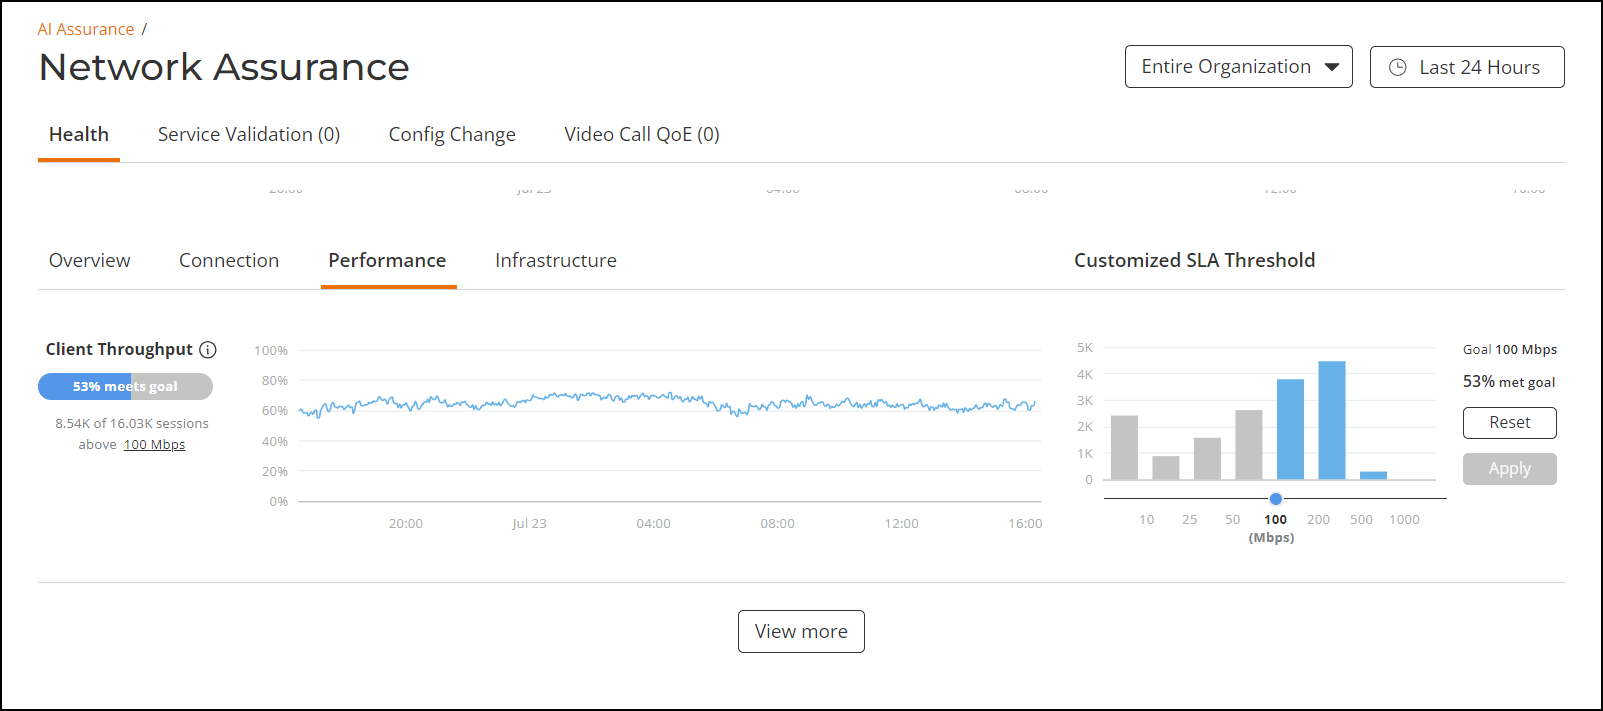
Furthermore in Network Assurance, you can evaluate network health based on a variety of custom thresholds that you can set, called goals. For example, you can set the goal (or threshold) to five seconds for all clients to connect to the network and confirm the number of clients accomplishing the five-second goal in real time.