Incidents
The Incidents page provides overall information about the incidents that have occurred on the network.
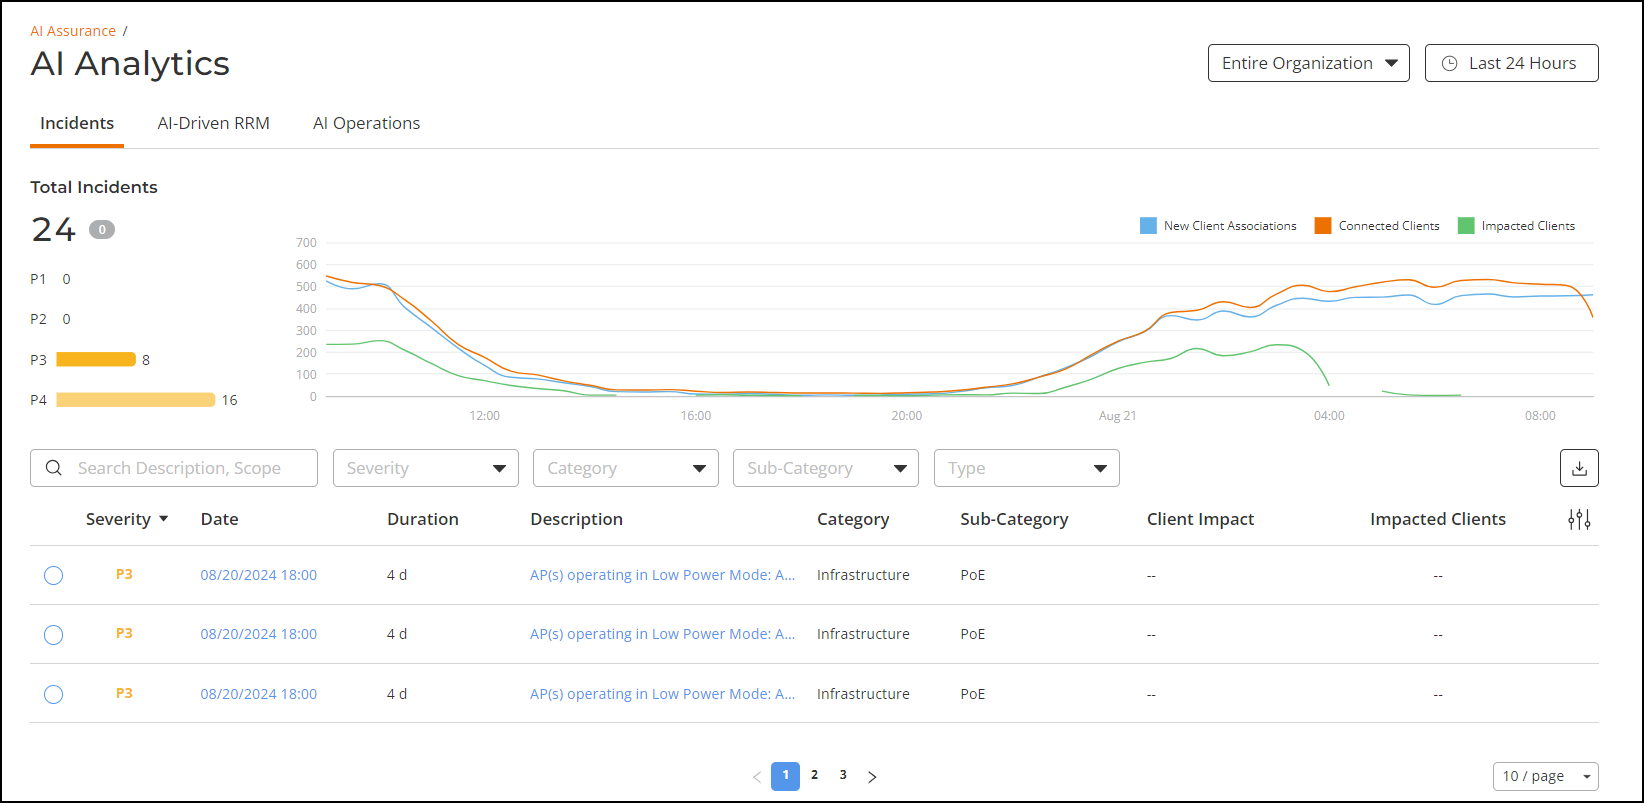
On the Navigation pane, click AI Assurance > AI Analytics > Incidents. The Incidents page is displayed, providing a breakdown of incidents by severity and category, allowing you to focus on incidents of interest, for which you can view details. Note that, by default, the information is provided for all of your networks for the last 24 hours, but you can modify the page filters for a specific network and customized span of time. For any given incident, you can view the severity, client impact, root cause, and recommendations, as well as the events, anomalies, data, or problems that were used to identify the incident.
The Incidents page has the following components:
- Total Incidents bar chart
- Client trends time-series chart
- Incidents Table
Click the Date attribute in the Incidents table to display the Incident Details page for the associated incident. This page displays a detailed report of the specific incident, including the information provided in the Incidents table, as well as root cause analysis and recommended actions, network impact, and associated metrics.