Dashboard
The Dashboard, which is the first page that displays after you log in to RUCKUS One, provides a snapshot of the AI-based analytics, networks, venues, devices, alarms, incidents, and wireless clients associated with networking devices.
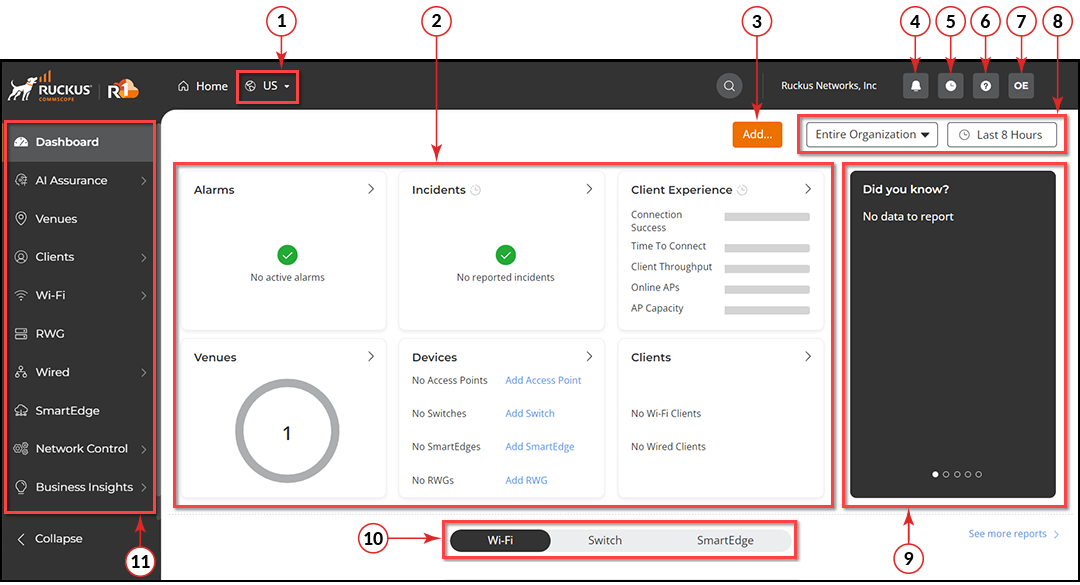
| Number | Tile's Name | Description |
|---|---|---|
| 1 | Region | The region to which your account belongs is automatically populated. |
| 2 | Status Area | Provides a single-pane insight analytics for the selected filters. |
| 3 | Add | Click Add to add a venue, a Wi-Fi network, or a device (such as a Wi-Fi AP or switch). |
| 4 | Alarms | Provides single-click access to a list of the uncleared alarms. |
| 5 | Activities | Provides single-click access to a list of the activities in your network. |
| 6 | Help | Displays help from different online resources. |
| 7 | Account | Displays the initials of the first and last name of the user account and provides access to configure account profile settings, change the account password, and log out of RUCKUS One |
| 8 | Display filter | Filters the information to display based on venues and time range. |
| 9 | Did you know? | Provides interesting insights from the available network statistics. |
| 10 | Reports | Displays reports about network status and devices. |
| 11 | Navigation pane | Allows you to quickly navigate through all the available menus and submenus. |