Configuration Change
You can monitor and analyze changes to network KPIs due to configuration changes and software changes from the Configuration Change page. Network KPIs can be compared before and after a configuration change is applied to the system, thereby presenting the impact of the configuration changes or software updates on the system and its devices.
On the Navigation bar, click . The Configuration Change page is displayed.
- Configuration Change tile
- Configuration Change table
- Health tile
The network node filter and Date and Time filter are displayed in the upper-right corner of the Content panel. These option controls the elements displayed within the Content Panel. To modify these options, refer to Navigating the RUCKUS One Portal.
Configuration Change Tile
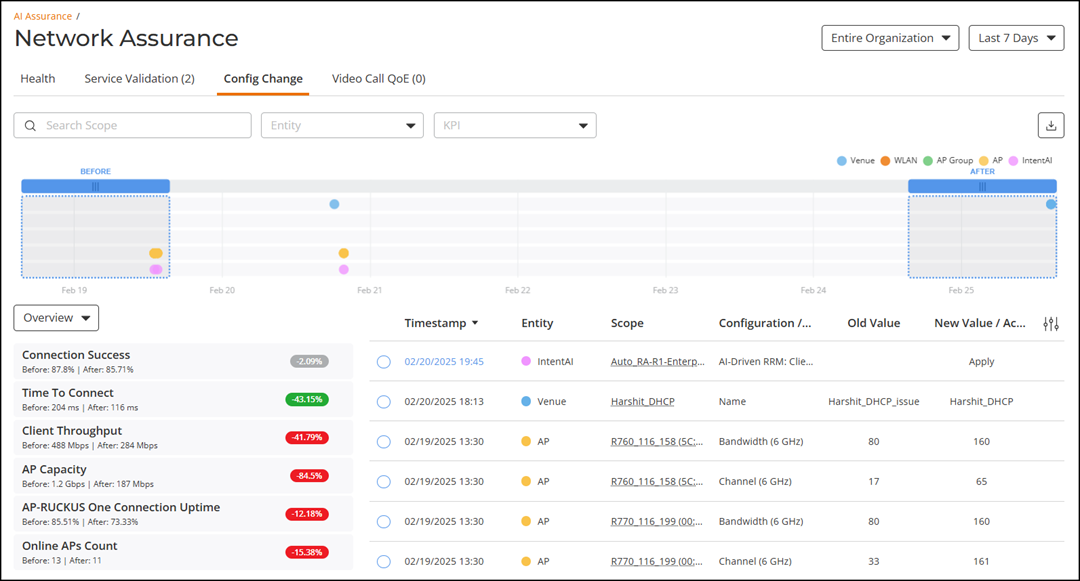
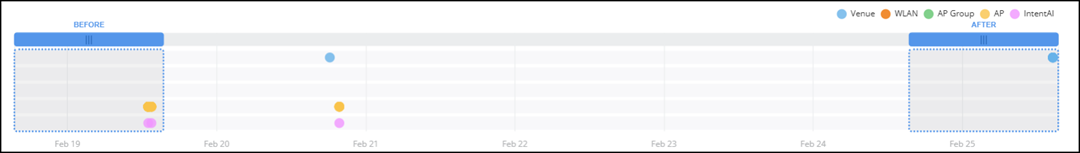
The Configuration Change tile visualizes configuration changes applied across different network levels, including Venue, WLAN, AP Group, and AP, for the selected time period in the Date and Time filter. It also features a visualization for IntentAI status changes, including actions like Apply, Revert, and Apply/Revert Failed. This improves visibility into IntentAI's automated operations, allowing you to monitor and analyze these changes over time. Each configuration change is represented as a dot on the time-series graph. The dot's color corresponds to the specific level where the change was applied, as indicated in the legend above the graph. Clicking the pointer at any instance on the timeline updates the History tile and Configuration Change table and vice versa. In the time series graph, pause the pointer over a dot to see when the configuration change was applied.
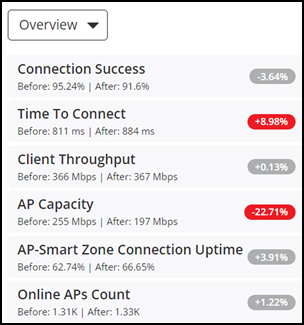
To determine the network health before and after the firmware update (the orange dot in the figure), scroll the Before lens to a time prior to the firmware update and scroll the After lens to a time after the firmware update. KPIs on the Health tile are computed and displayed immediately, providing clear "before" and "after" values for each KPI. In the Health tile, by default, the Overview tab information is displayed. Select the different tabs from the drop down to view the other tabs information.
Configuration Change Table
The Configuration Change Table provides a detailed, tabular view of configuration changes applied during the selected time period in the Date and Time filter complementing the Configuration Change tile by displaying precise insights into each change. It includes several key columns such as Timestamp which indicates the exact date and time of the change, with IntentAI-driven changes featuring a clickable link that redirects users to the Intent Details page for further analysis. The Entity column specifies the network component affected, such as Venue, WLAN, AP Group, AP, or IntentAI. The Scope column identifies the specific entity name where the configuration was applied, such as an AP name, or Venue name. The Configuration / Intent column displays the IntentAI status changes or specific setting that was modified. The Old Value column presents the previous configuration before the change. The New Value / Action column displays the updated value or action taken.
Additionally, you can also filter for relevant configuration changes that are specific to a particular KPI by simply clicking the KPI in the Health tile, or the KPI filter above the table.
To apply the KPI filter, click on the KPI filter field, select the attributes from the drop down, and click Apply.
Health Tile