Navigating the RUCKUS One Portal
The RUCKUS One web interface is a graphical user interface (GUI) for managing and monitoring your networking devices, venues, and wireless networks.
After you complete signing up for a RUCKUS One account, you can access the RUCKUS One web interface from any device (desktop, laptop, or smartphone) that is connected to the Internet.
| Number | Element | Description |
|---|---|---|
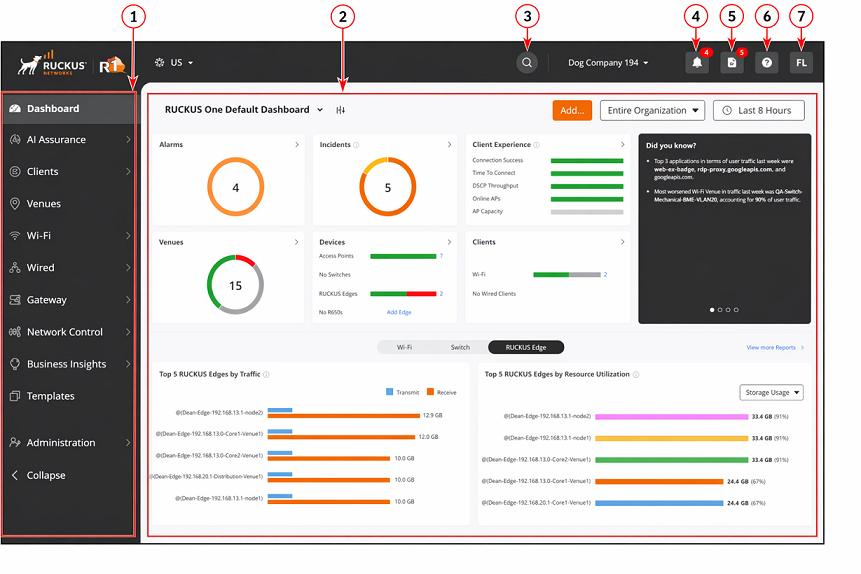
| 1 | Navigation bar | Use the navigation bar to navigate
through the main pages of RUCKUS One:
|
| 2 | Content area | When you click on an item on the navigation bar, the related information (tables, lists, graphs, configuration options, and so on) is displayed in the content area. By default, the Dashboard information is displayed; refer to Getting to Know the Dashboard for details. |
| 3 |  (Search) |
Click the  icon to search for specific navigation bar
sub-menu options and specific entries from data tables across RUCKUS One. Results are grouped by category. Refer to Searching for Menu Options and Data for
details. icon to search for specific navigation bar
sub-menu options and specific entries from data tables across RUCKUS One. Results are grouped by category. Refer to Searching for Menu Options and Data for
details. |
| 4 |
 (Alarms) |
Click the  icon to view the latest alarms that have
occurred on the managed devices. If a number is displayed above the
icon, it indicates the number of new alarms that have occurred since you
last viewed the list. Refer to Alarms for more information. icon to view the latest alarms that have
occurred on the managed devices. If a number is displayed above the
icon, it indicates the number of new alarms that have occurred since you
last viewed the list. Refer to Alarms for more information. |
| 5 |  (Activities) |
Click the  icon to view the most recent notifications
of activities. icon to view the most recent notifications
of activities.The Activities sidebar displays for each activity: a status icon, a clickable description that takes you to the Activity Details sidebar, and the timestamp. The sidebar provides options for you to filter the list by Status, enable/disable Sleep toast notifications, and View all activities (which takes you to the page.Refer to Viewing Activities for further information. |
| 6 | 
(Help) |
Click the  icon to display: icon to display:
|
| 7 |  (Account) |
The Click the icon and select from the drop-down menu:
|
 icon contains the first and last name
initials of the
icon contains the first and last name
initials of the