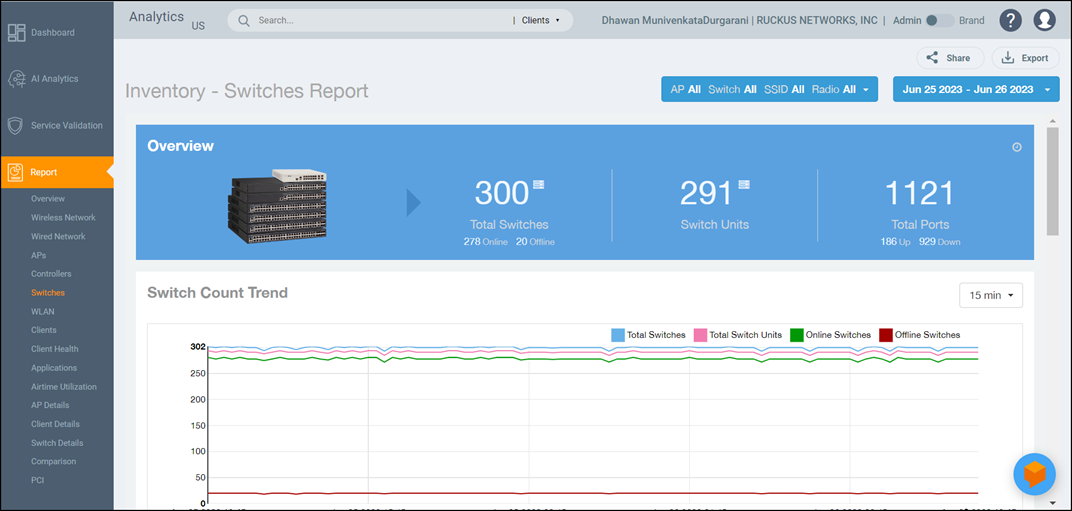
Inventory - Switches Report
The Inventory - Switches Report provides details on switch inventory, including switch models and software versions that are being used the most.
From the navigation bar, select .
- Overview tile
- Switch Count Trend Graph
- Top Switch Software Versions tile
- Top Switch Models tile
- Port Status Trend tile
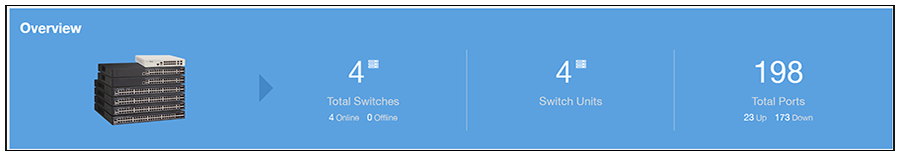
Overview Tile
- Total number of switches (and how many are online and offline)
- Number of switch units
- Total number of ports (and how many are up and down)
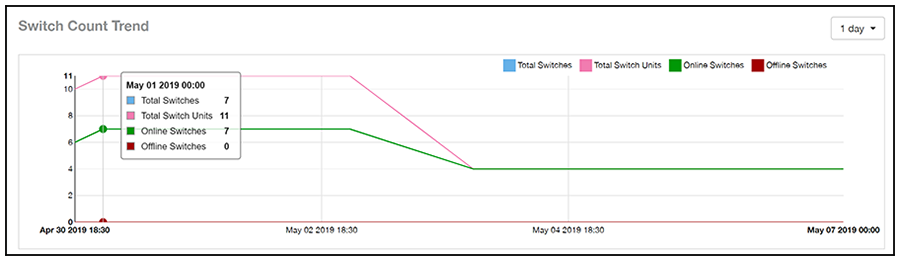
Switch Count Trend Graph
The Switch Count Trend graph of the Inventory - Switches Report displays the trend of total switches, total switch units, online status, and offline status over specified time intervals.
Use the menu to specify the time granularity. If you pause the pointer over the line graph, an information box is displayed containing the details on the selected data points. Click any of the colored squares to display the selected switch details in the line graph.
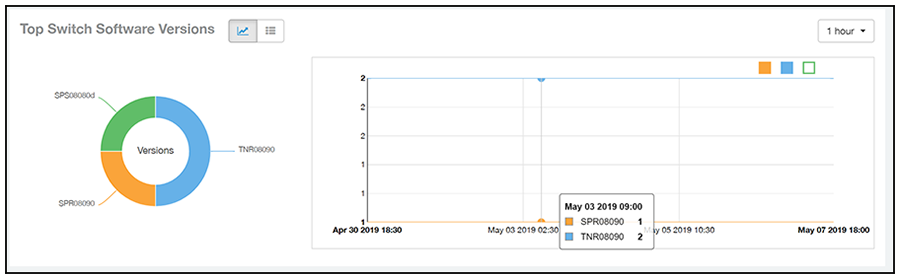
Top Switch Software Versions Tile
The Top Switch Software Versions donut chart and graph of the Inventory - Switches Report display the most-used switch software versions in your network, and show the number of switches using each version.
Use the menu to specify the time granularity. If you pause the pointer over the donut chart and the line graph, an information box is displayed containing the details on the selected data points. Click any of the colored squares to display the selected switch details in the line graph.
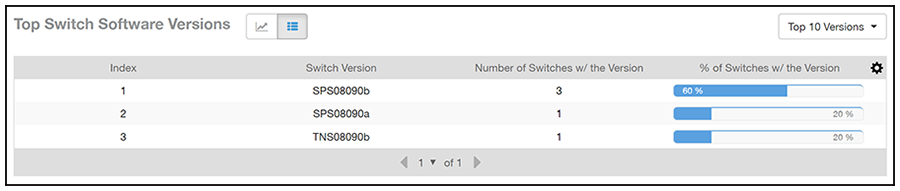
Click the gear icon ( ) to select the columns to display, and click any column heading to sort the table by that column. The table is sorted on the top switch software version by default. You can select the top 10 (default value), 20, 50, or 100 software versions to display, or display all of the software versions. The number of rows per page is defined by the
Rows per Page option in the table settings menu.
) to select the columns to display, and click any column heading to sort the table by that column. The table is sorted on the top switch software version by default. You can select the top 10 (default value), 20, 50, or 100 software versions to display, or display all of the software versions. The number of rows per page is defined by the
Rows per Page option in the table settings menu.
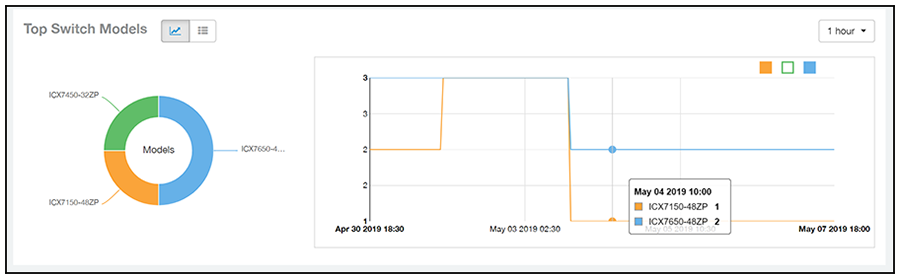
Top Switch Models Tile
The Top Switch Models donut chart and line graph of the Inventory - Switches Report display the model type that is most often used in your network.
Use the menu to specify the time granularity. If you pause the pointer over the donut chart and the line graph, an information box is displayed containing the details on the selected data points. Click any of the colored squares to display the selected switch details in the line graph.
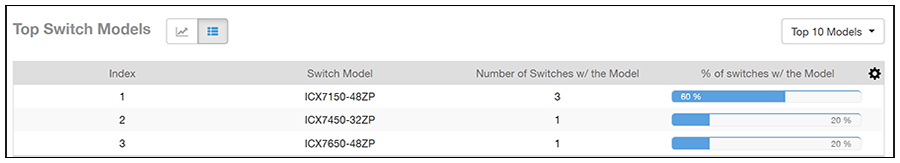
Click the gear icon () to select the columns to display, and click any column heading to sort the table by that column. The table is sorted on the top switch model by default. You can select the top 10 (default value), 20, 50, or 100 models to display, or display all of the switch models. The number of rows per page is defined by the
Rows per Page option in the table settings menu.
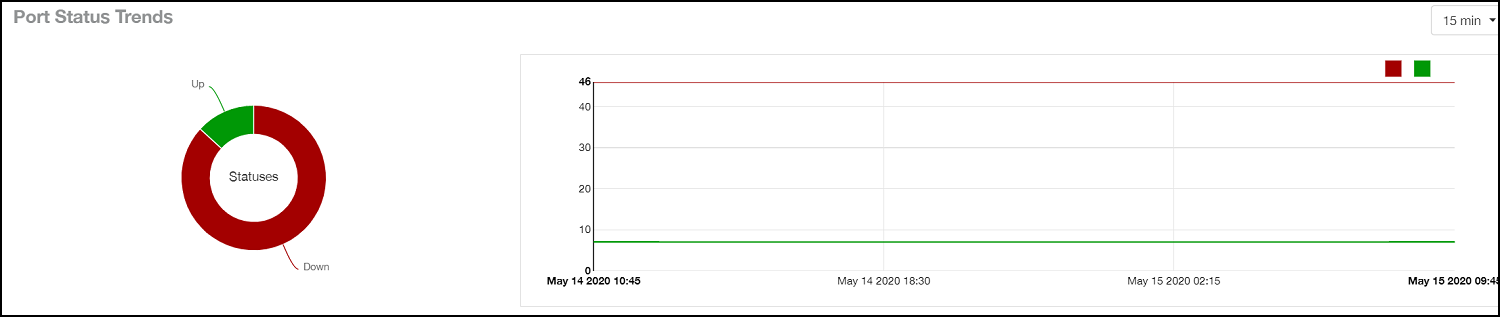
Port Status Trends Tile
The Port Status Trends donut chart and line graph of the Inventory - Switches Report display the status of the ports as up and down.