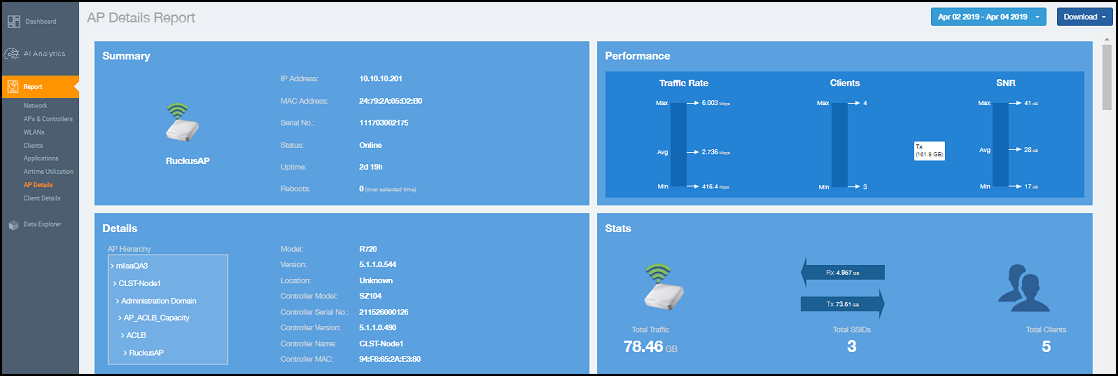
AP Details Report
The AP Details Report provides details about one specific access point.
From the navigation bar, select Report > AP Details and enter the MAC address of the AP for which you want to view the details.
- Summary tile
- Performance tile
- Details tile
- Stats tile
- Uptime History graph
- Traffic Trend graphs
- Unique Clients Trend Over Time graphs
- Top 10 Clients by Traffic Volume tile
- Top 10 Applications by Traffic Volume tile
- Top SSIDs by Traffic table
- Sessions table
- RSS Trend graph
- SNR Trend graph
- Airtime Utilization Trend graphs
- Clients Details table
- Alarms table
- Events table
- Anomalies graph
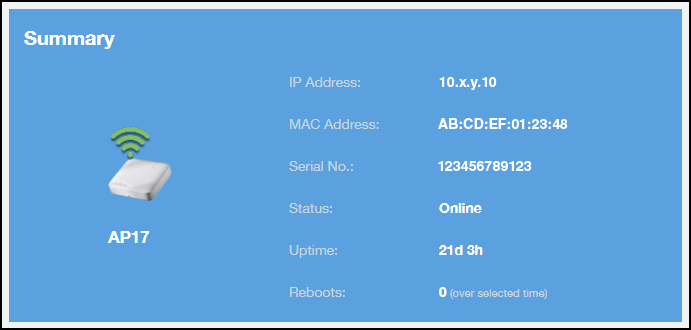
Summary Tile
The Summary tile of the AP Details Report displays basic information about a specific AP.
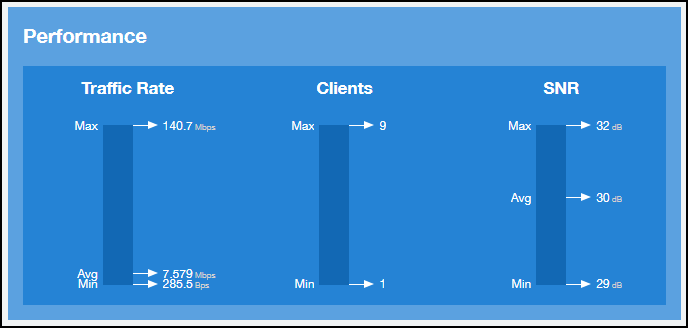
Performance Tile
The Performance tile of the AP Details Report displays performance data about the specified AP.
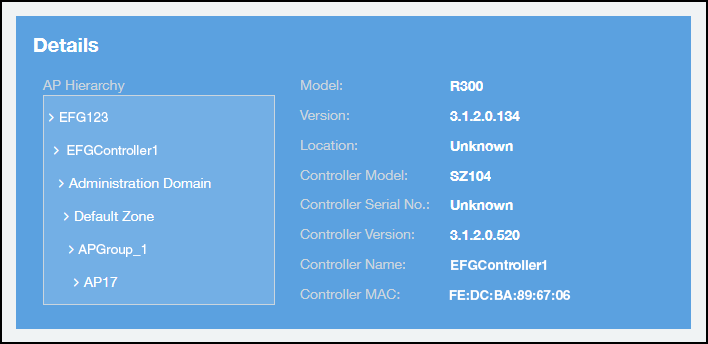
Details Tile
The Details tile of the AP Details Report contains some details about the specified AP, including its hierarchy in the network.
The AP shown in this example is named AP17. It belongs to a group of access points that has been named APGroup_1. EFGController1 in this example is one of the controllers being used on a wireless network named EFG123.
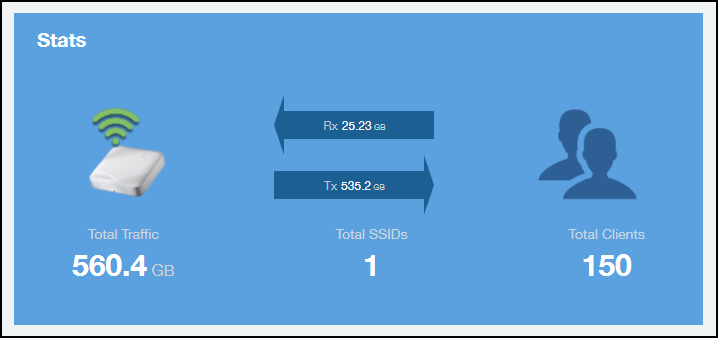
Stats Tile
The Stats tile of the AP Details Report displays some traffic statistics about the specified AP.
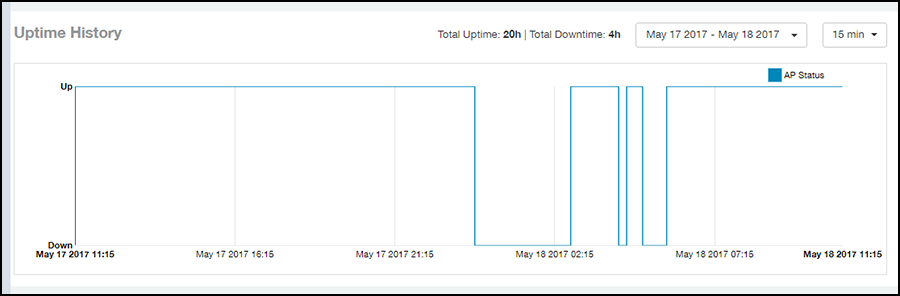
Uptime History Graph
The Uptime History graph of the AP Details Report shows when this AP has been up or down over different time periods.
The blue bar indicates when the AP has been up or down. Use the menus to specify the time frame and the granularity of the graph.
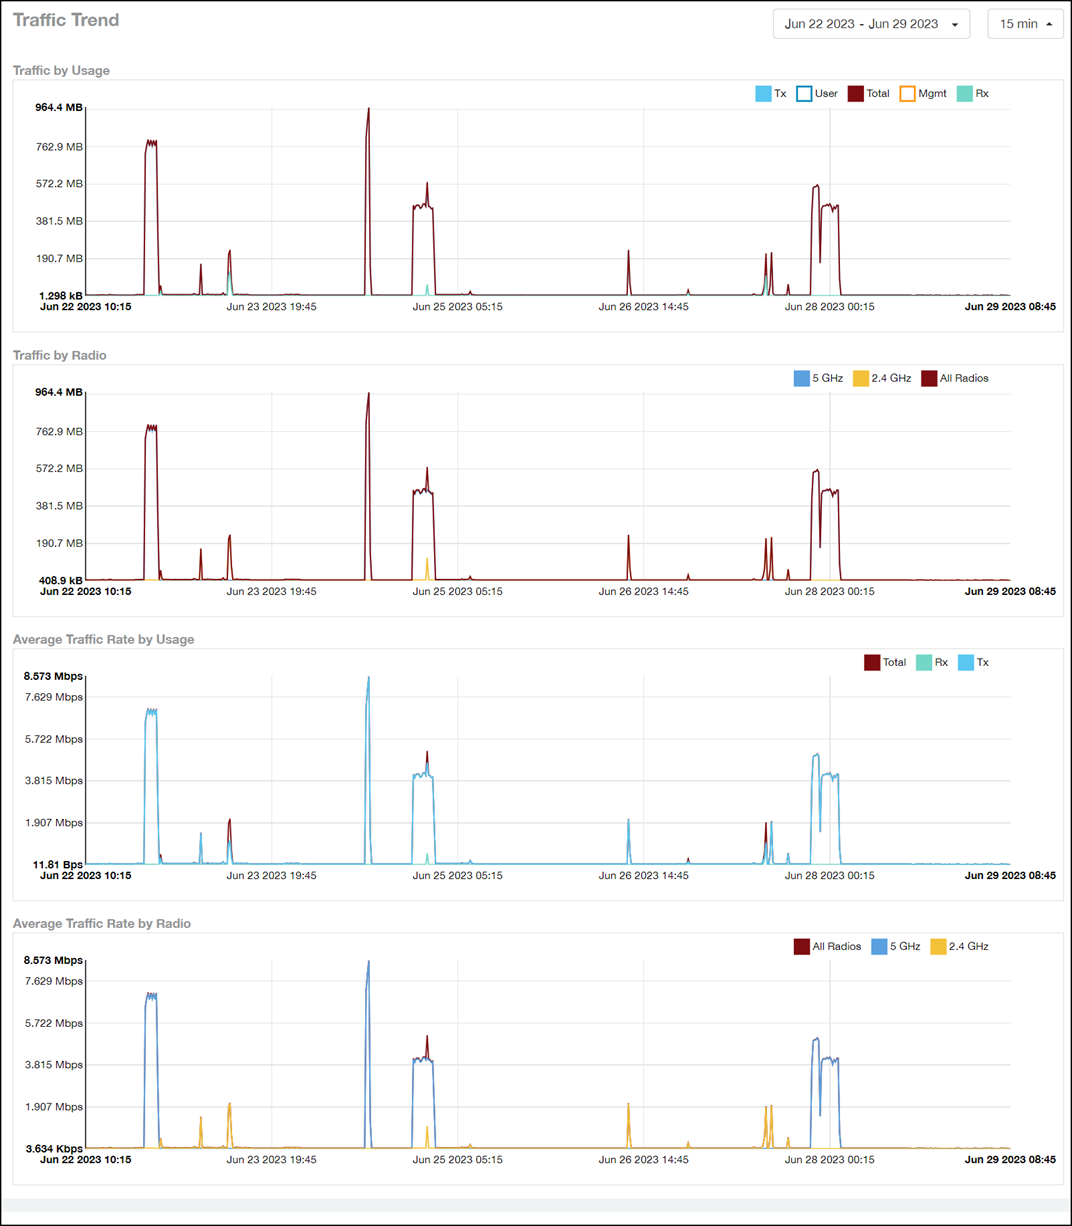
Traffic Trend Graphs
The Traffic Trend graphs of the AP Details Report contain four line graphs that provide information about the specified AP: two types of line graphs that depict traffic by usage and two types of line graphs that depict traffic by radio type for this AP.
Use the menus to specify the time frame and the granularity of the graphs.
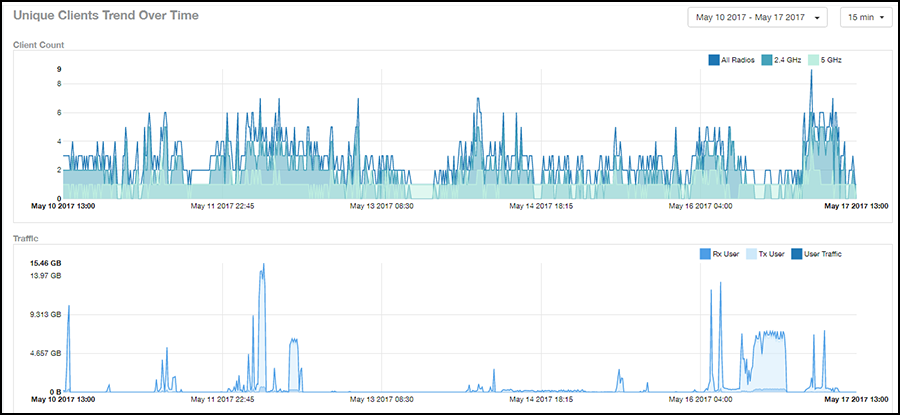
Unique Clients Trend Over Time Graphs
The Unique Clients Trend Over Time graphs of the AP Details Report contain two line graphs that provide information about unique clients associated with the specified AP over a certain time period.
One graph shows the number of unique clients and the other shows the traffic generated by unique clients.
Use the menus to specify the time frame and the granularity of the graphs.
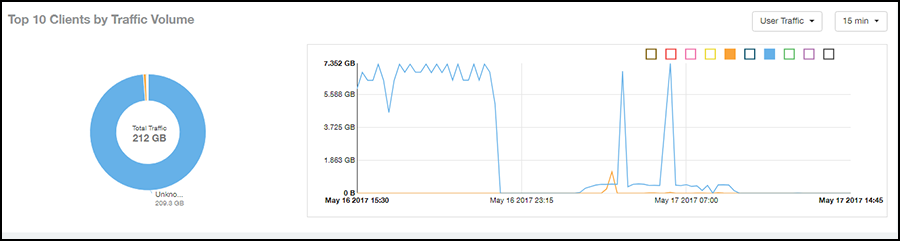
Top 10 Clients by Traffic Volume Tile
The Top 10 Clients by Traffic Volume donut chart and line graph of the AP Details Report depict the clients that have generated the largest volume of traffic over this AP for a specified period of time.
Use the menus to specify the time type and the granularity of the graph. In the graph, click any of the colored squares to display the corresponding client details in the line graph.
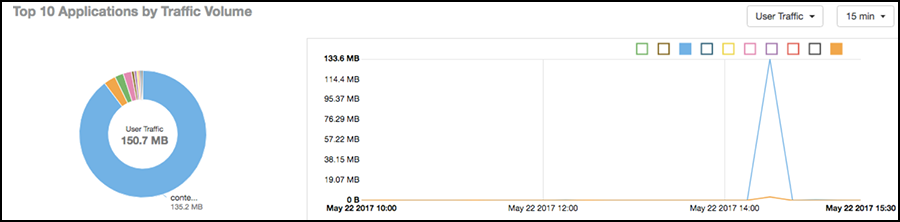
Top 10 Applications by Traffic Volume Tile
The Top 10 Applications by Traffic Volume donut chart and line graph of the AP Details Report depict the applications that have generated the largest volume of traffic over this AP for a specified period of time.
Use the menus to specify the traffic type and the granularity of the graph. In the graph, click any of the colored squares to display the corresponding application details in the line graph.
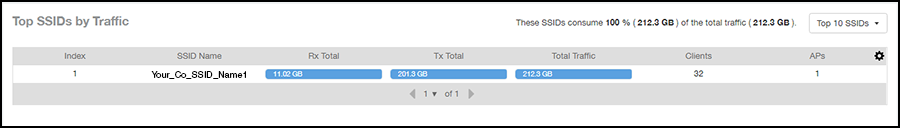
Top SSIDs by Traffic Table
The Top SSIDs by Traffic table of the AP Details Report lists the SSIDs that have generated the most traffic associated with this AP.
A service set identifier (SSID) is a logical group of APs. An AP can belong to multiple SSIDs. Use the menu to specify the number of SSIDs to display.
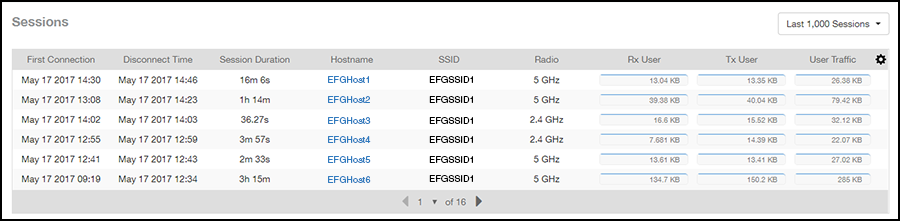
Sessions Table
The Sessions table of the AP Details Report provides details for the number of client sessions that you specify for this AP.
Use the menu to specify how many sessions to display.
If you click one of the client links in the Hostname column, you are directed to the Client Details Report for that client.
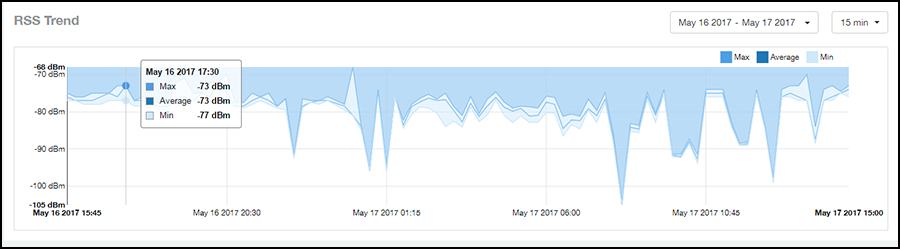
RSS Trend Graph
The RSS Trend graph of the AP Details Report depicts the received signal strength trends over time for this AP.
Use the menus to specify the time frame and the granularity of the graph.
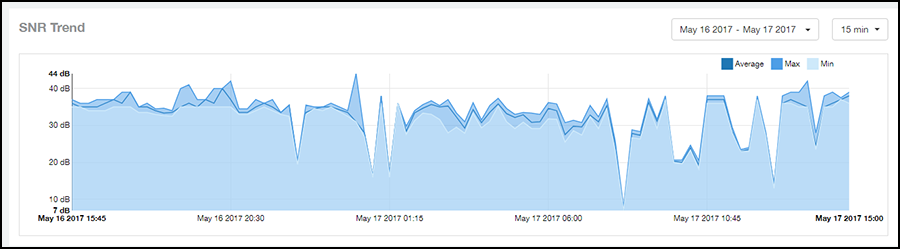
SNR Trend Graph
The SNR Trend graph of the AP Details Report depicts the signal-to-noise ratio over time for this AP.
Use the menus to select the time frame and the granularity for the graph.
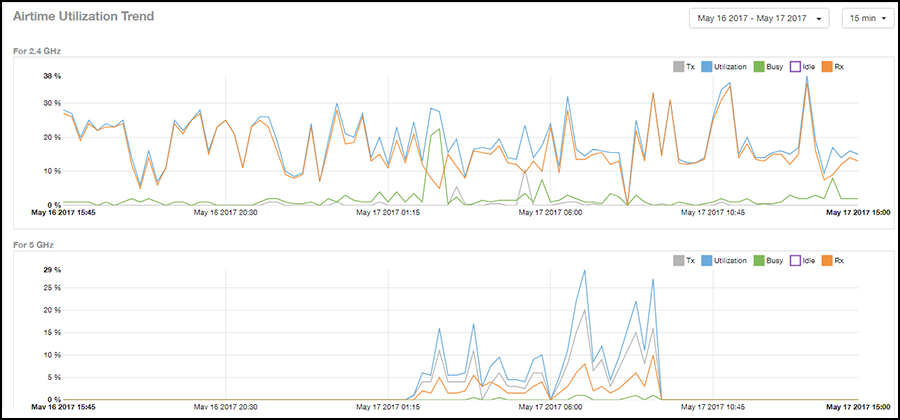
Airtime Utilization Trend Graphs
The Airtime Utilization Trend graphs of the AP Details Report depict the airtime utilization for this AP, by radio type, over a specified time period.
Use the menus to select the time frame and the granularity for the graphs.
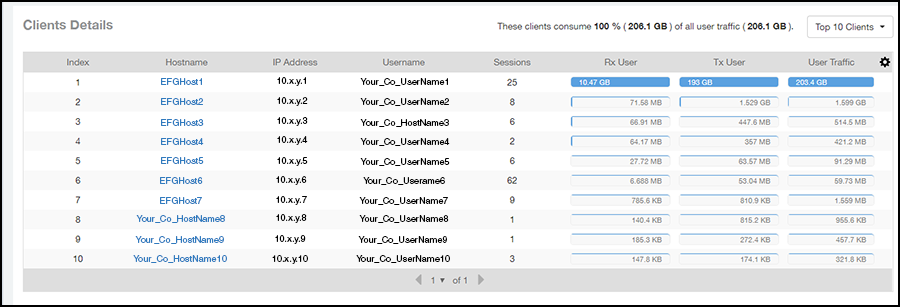
Clients Details Table
The Clients Details table of the AP Details Report provides details for the number of top clients that you specify for this AP.
Use the menu to specify how many top clients to display.
If you click one of the client links in the Hostname column, you are directed to the Client Details Report for that client.
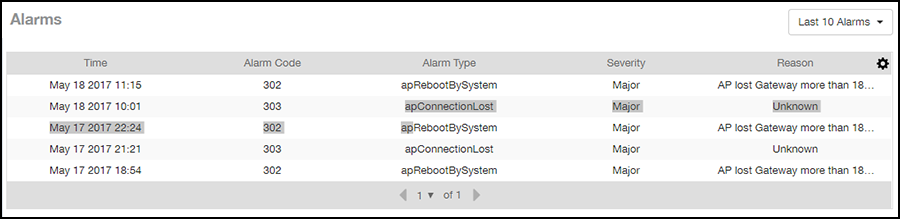
Alarms Table
The Alarms table of the AP Details Report lists the alarms generated for this AP for the time period that you specify.
Use the menu to specify how many alarms to display.
Click the gear icon ( ) to select the columns to display, and click any column heading to sort the table by that column.
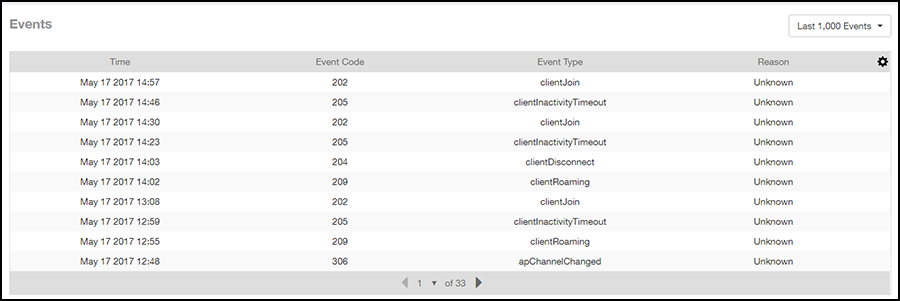
Events Table
The Events table of the AP Details Report lists the events generated for this AP for the time period that you specify.
Use the menu to specify how many events to display.
Click the gear icon () to select the columns to display, and click any column heading to sort the table by that column.
Anomalies Graph
The Anomalies graph of the AP Details Report provides information about any behavior that may be out of the normal range for this AP, such as high reboot count, unusually high or low user traffic, unusually high or low client count, or unusually high or low session count.