Wired Network Report
The Wired Network Report provides details of total traffic, APs, and clients on the network. It also contains information regarding the received and transmitted traffic between them.
From the navigation bar, select Report > Wired Network.
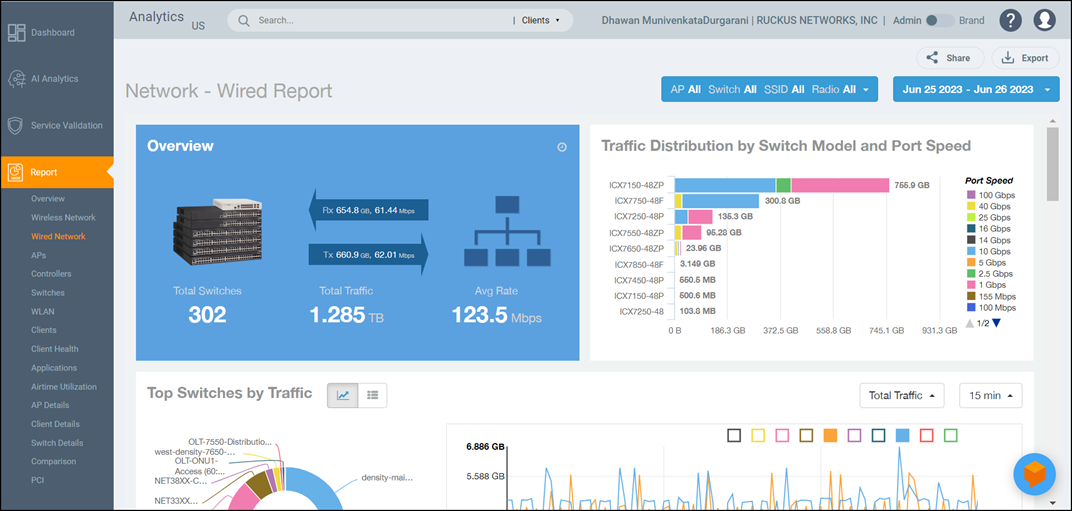
- Overview tile
- Traffic Distribution by Switch Model and Port Speed tile
- Top Switches by Traffic tile
- Top Switches by PoE Usage tile
- Top Switches by Errors tile
- Traffic Trend tile
- Error Trend tile
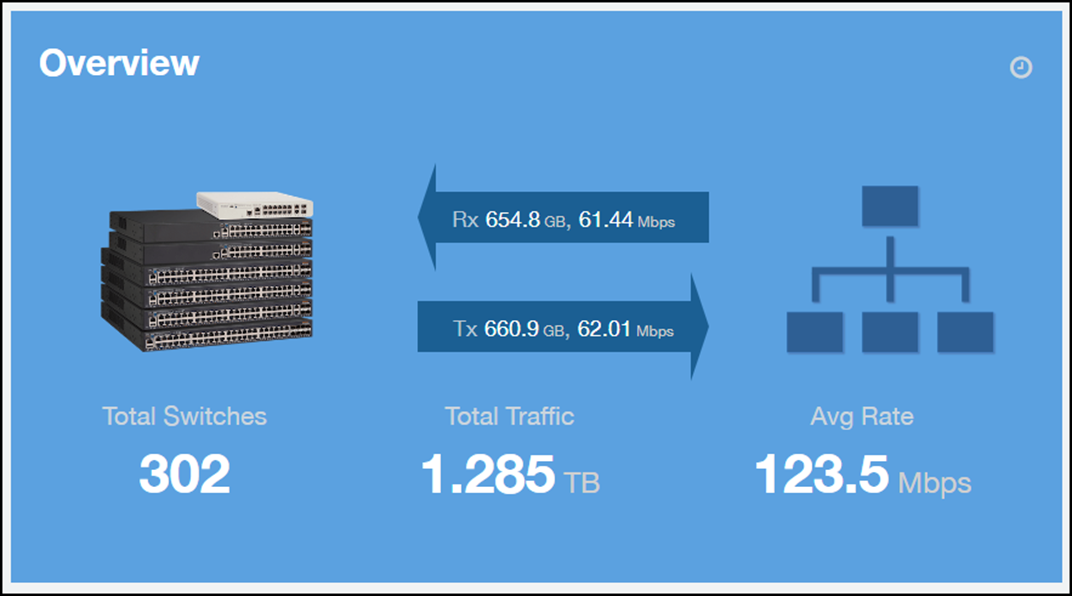
Overview Tile
The Overview tile of the Wired Network Report provides the following information, based on your selection of the AP, SSID, Radio, and Date Range filters:
- Total number of APs
- Total traffic and the average traffic rate
- Total traffic received and transmitted and the average traffic rate
- Total clients on the network
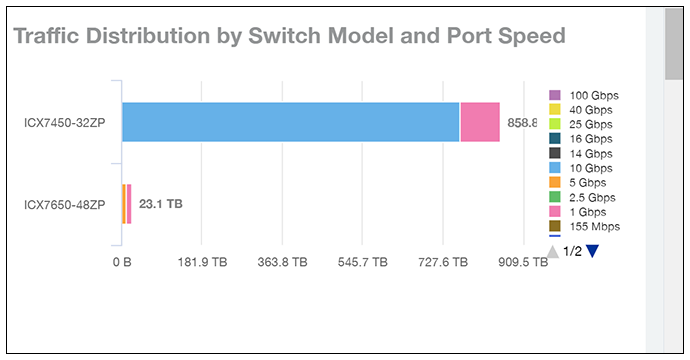
Traffic Distribution by Switch Model and Port Speed Chart
The Traffic Distribution by Switch Model and Port Speed chart of the Wired Network Report displays the distribution of traffic by port speed for each switch model being used.
Use this chart to display traffic distribution based on your selection of APs, SSID, Radio, and Date Range filters.
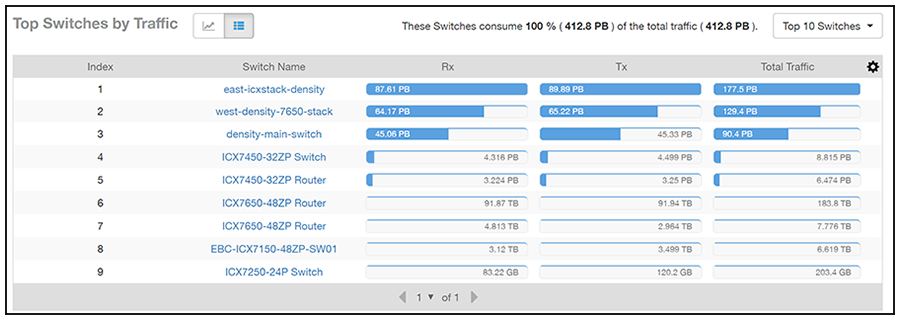
Top Switches by Traffic Tile
The Top Switches by Traffic donut chart and graph of the Wired Network Report display which wired switches have the most traffic. You can use the traffic menu to show total traffic, transmitted traffic only, or received traffic only; and use the time menu to specify the time granularity.
If you pause the pointer over the donut chart or the line graph, an information box is displayed containing the details on the selected data points. You can click one of the areas of the donut chart to go to the Switch Details dashboard for the corresponding switch. Click any of the colored squares to display the selected switch details in the line graph.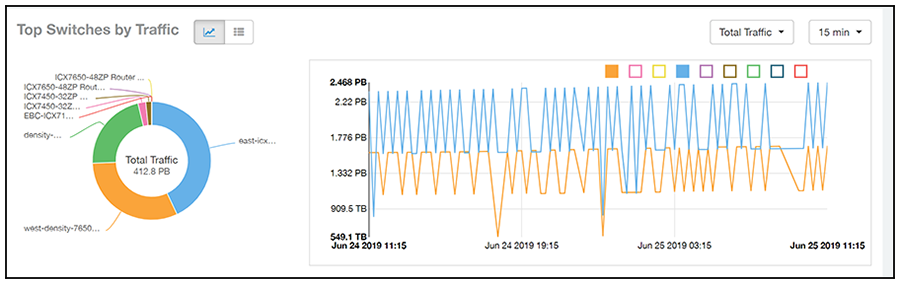
Click the gear icon ( ) to select the columns to display, and click any column heading to sort the table by that column. You can select the top 10 (default value), 20, 50, or 100 switches to display, or display all of the switch models. The number of rows per page is defined by the
Rows per Page option in the table settings menu.
) to select the columns to display, and click any column heading to sort the table by that column. You can select the top 10 (default value), 20, 50, or 100 switches to display, or display all of the switch models. The number of rows per page is defined by the
Rows per Page option in the table settings menu.
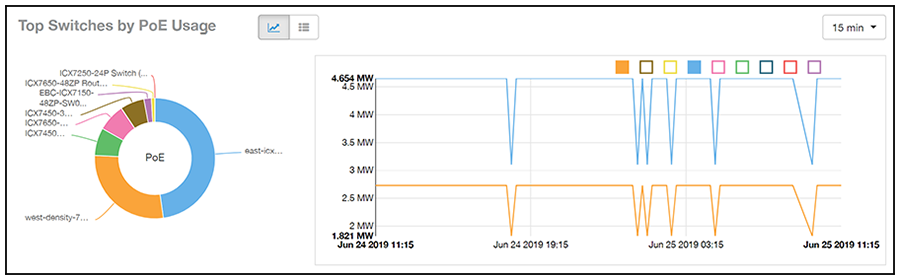
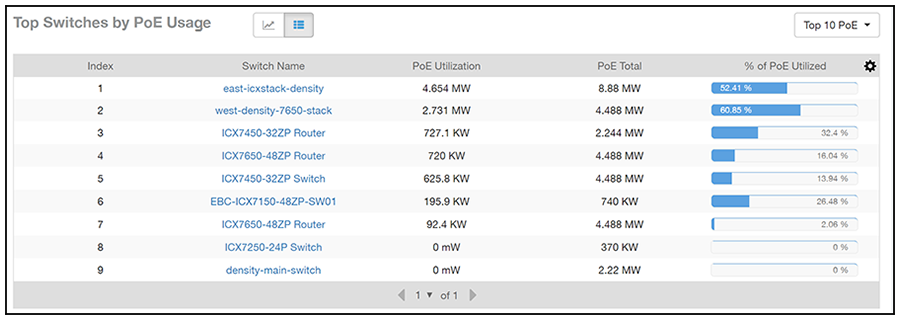
Top Switches by PoE Usage Tile
The Top Switches by PoE Usage donut chart and graph of the Wired Network Report display which wired switches are utilizing the most power over the Internet. You can use the menu to specify the time granularity.
If you pause the pointer over the donut chart or the line graph, an information box is displayed containing the details on the selected data points. You can click one of the areas of the donut chart to go to the Switch Details dashboard for the corresponding switch. Click any of the colored squares to display the selected switch details in the line graph.
Click the gear icon () to select the columns to display, and click any column heading to sort the table by that column. You can select the top 10 (default value), 20, 50, or 100 switches to display, or display all of the switch models. The number of rows per page is defined by the
Rows per Page option in the table settings menu.
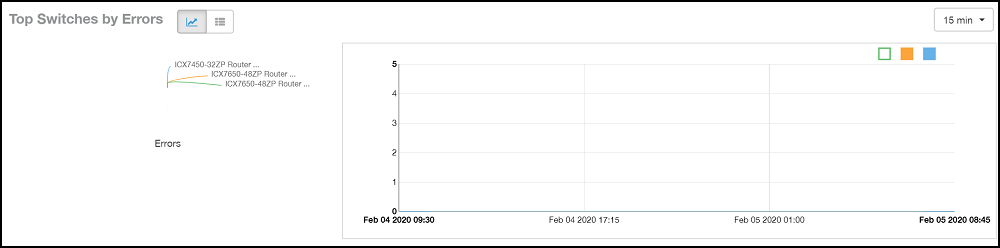
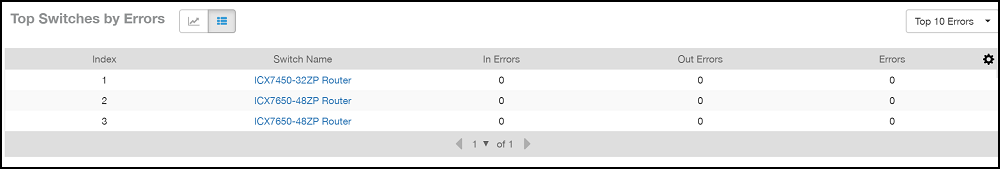
Top Switches by Errors Tile
The Top Switches by Errors donut chart and graph of the Wired Network Report display the error count for switches.
If you pause the pointer over the donut chart or the line graph, an information box is displayed containing the details on the selected data points. You can click one of the areas of the donut chart to go to the Switch Details dashboard for the corresponding switch. Click any of the colored squares to display the selected switch details in the line graph.
Click the gear icon () to select the columns to display, and click any column heading to sort the table by that column. You can select the top 10 (default value), 20, 50, or 100 errors to display, or display all of the errors. The number of rows per page is defined by the
Rows per Page option in the table settings menu.
Traffic Trend Graph
The Traffic Trend graph of the Wired Network Report contain two line graphs that provide traffic information about the wired switches in the network.Use the menu to specify the time granularity of the graphs.
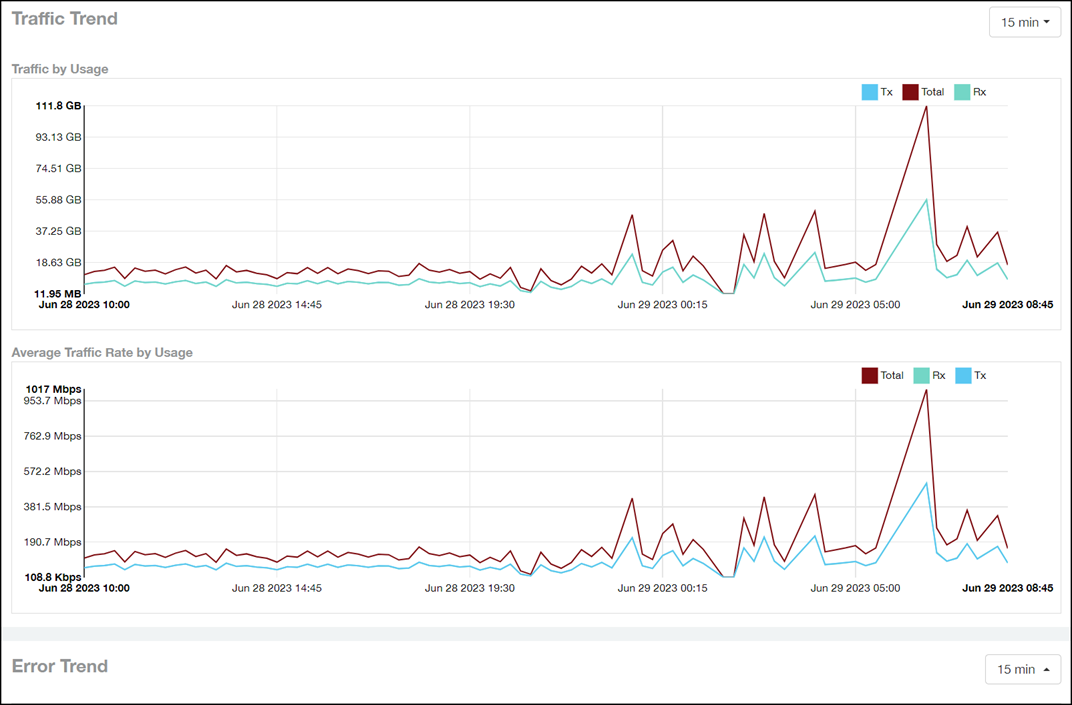
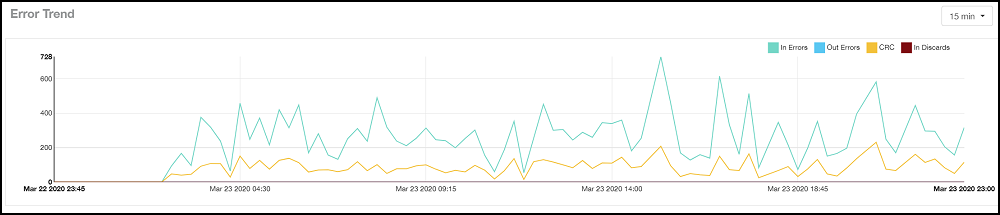
Error Trend Graph
The Error Trend graph of the Wired Network Report contains a line graph that provides the error count information over time: In Errors, Out Errors, CRC, and In Discards.
Use the menu to specify the time granularity of the graph.