Client Troubleshoot Page
The client troubleshoot page provides you details about the connectivity of a particular client.
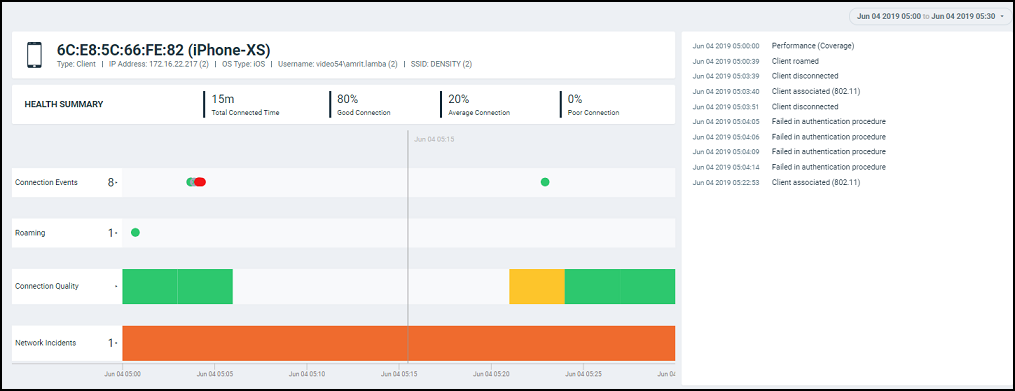
The header displays the MAC address of the client followed by its host name. The line underneath the header lists the following client attributes:
- MAC address
- IP address
- OS type
- Username
- SSID
For data fields in which there are multiple entries (such as IP address), the system shows a value in parentheses (for example, (2)). Pausing the pointer on this number shows the additional values for the field.
The Health Summary shows the total time during which the client was connected to the network. The Health Summary highlights the following measurements:
- Total Connected Time
- Percentage of Good Connection
- Percentage of Average Connection
- Percentage of Poor Connection
The health classification (good, average, and poor) depends on the Connection Quality metrics, which consist of SNR, MCS, and Client Capacity metrics.
The Connection Events shows the connection status of the client on the particular WLAN for a specific AP. The connection events are classified (success, failure, slow, and disconnect), and are identified with the following colors:
- Green: Successful connection. Pause the pointer over the green dots to view more information such as the AP MAC address, AP name, SSID and Radio.
- Red circle with exclamation point: Failed connection.
You can also click the red circle to view the time of the failure scenario (for
example, whether the failure occurred during the EAP request, DHCP discovery, and so
on). Pausing the pointer over the circle provides a quick snapshot of information
such as the exact time of failure, the type of failure, the client IP address,
connection diagram analyzing the point of failure and so on. The failed path is
denoted by a red arrow, as shown in the figure. The figure depicts a failure when
EAP Identifier Mismatch happens.
Failure Due to EAP Identifier Mismatch 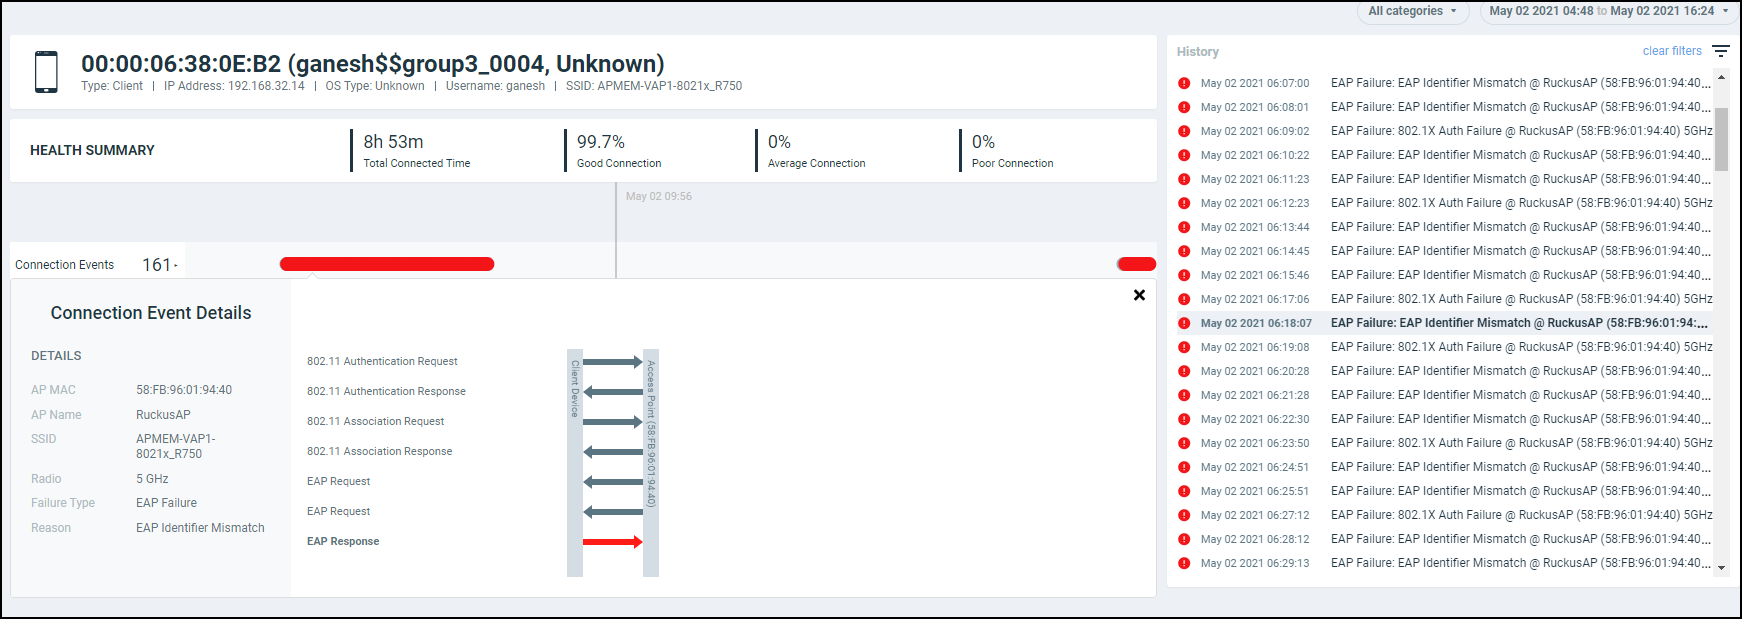
- Yellow: Slow (long time to connect to connection)
- Gray: Disconnected
Roaming shows the connection events and detailed metrics of the client when it roams between multiple APs. You can select the menu to view the roaming AP details. You can also pause the pointer over the graph to view more information such as radio mode, spatial stream, bandwidth and so on. These details help in troubleshooting issues that arise when clients roam from one AP to another. A roaming event is identified with the following colors:
- Green: Successful roam. Pause the pointer over the dot for more information.
- Red circle with exclamation point: Failed connection. Pause the pointer over the dot for more information.
The Connection Quality shows the quality of the service the client experiences throughout of the network. The connection quality is identified with the following colors:
- Green: Good
- Red: Poor
- Yellow: Average
Network Incidents shows any incidents that affected the client. The incidents are classified (client connection, performance, and infrastructure), and are identified with the following colors and severities:
- Red: P1
- Dark Orange: P2
- Orange: P3
- Yellow: P4
Based on the client access permissions set in the resource group, the client is only able to view the data for APs for which access permission are granted. If the client roams to an AP for which access permissions are not granted, the AP data is not available to view even though the connection between client and AP (roamed to) are established.
Packet Capture (PCAP)
This is a collection of packets generated for all failure events with respect to the specific client. This allows the clients admins to inspect network packets and troubleshoot the issues. All PCAP reports will be stored for three months before they are deleted.
- Search for the clients name in the Client Troubleshoot
page Search field.
Client Troubleshoot - PCAP 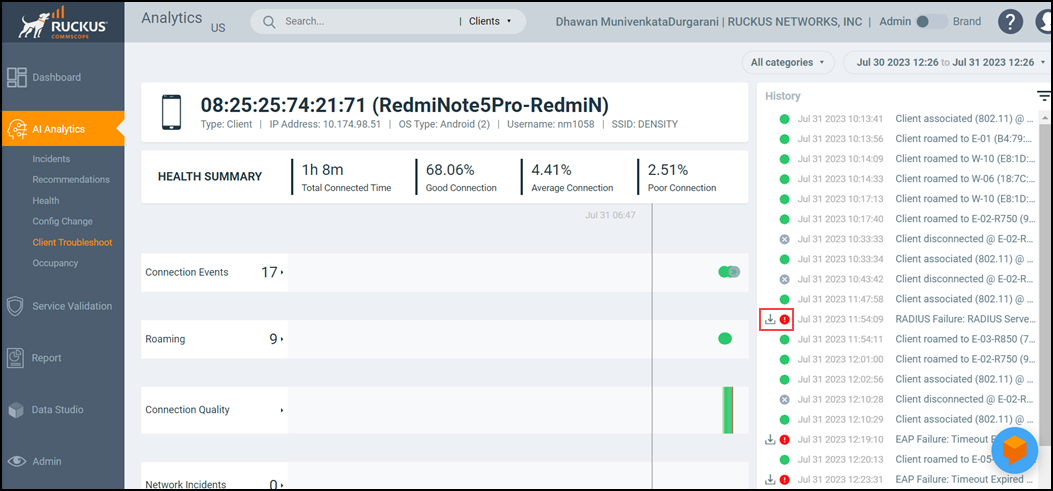
- In the History tab, click failure events. The
Connection Event Details dialog box is
displayed.
Connection Event Details Dialog Box 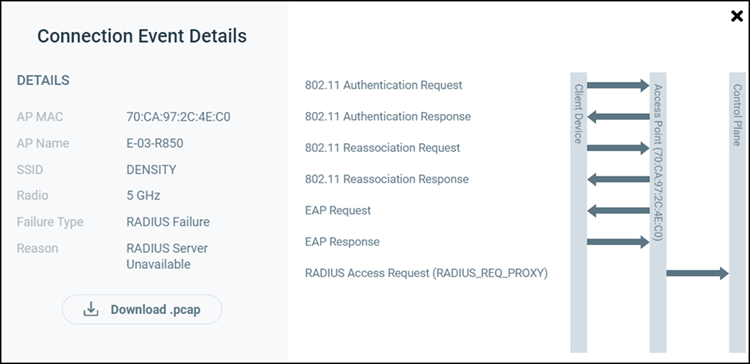
- Click Download .pcap icon to download the zip file.