Occupancy Page
Occupancy analytics data provides insights into space utilization within a facility, such as the most heavily used area or the predominantly least-used area within the facility.
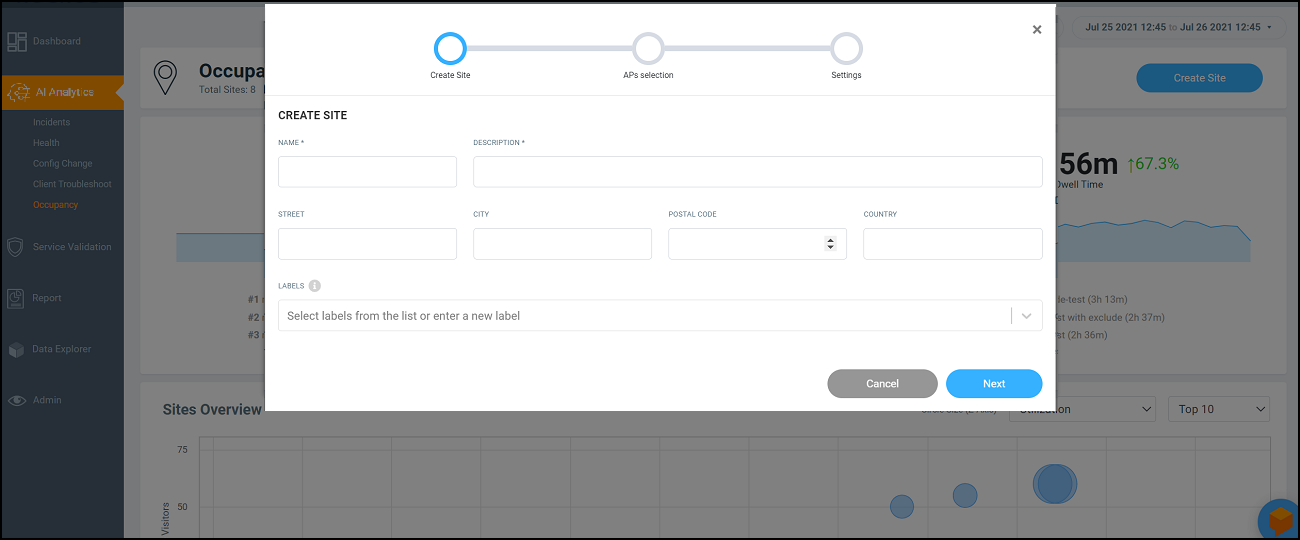
- From the Occupancy page, click Create Site.
-
Enter the name of the site, a description (an area of the facility for which your are creating the site, for example, the gym, the lobby, the third floor, or a similar area), and the street, city, postal code, and country of the site. Also, select a label to identify the site or create a new label term.
Note: You can include one or more labels for a site. Labels make searching for a particular site easy, especially when there are multiple sites within the network. - Click Next.
- Select the APs you want to group within this site.
- Click Next.
- In the Settings page, set the maximum capacity per AP. Occupancy Analytics engine is always active and powers the email notification feature. Email notifications are designed to alert site owners when the occupancy reaches or exceeds 100% of maximum site capacity. Configuration for this feature is available in the Settings page. Based on the APs you selected, the number of APs are populated and the maximum capacity of the site is calculated and displayed. The site utilization is computed every 15min based on the maximum capacity set for the site. When the site utilization percentage reaches 100%, an email notification is sent to the address configured in the Settings page. You can include one or more e-mail addresses for communication to notify when the site utilization percentage reaches 100%.
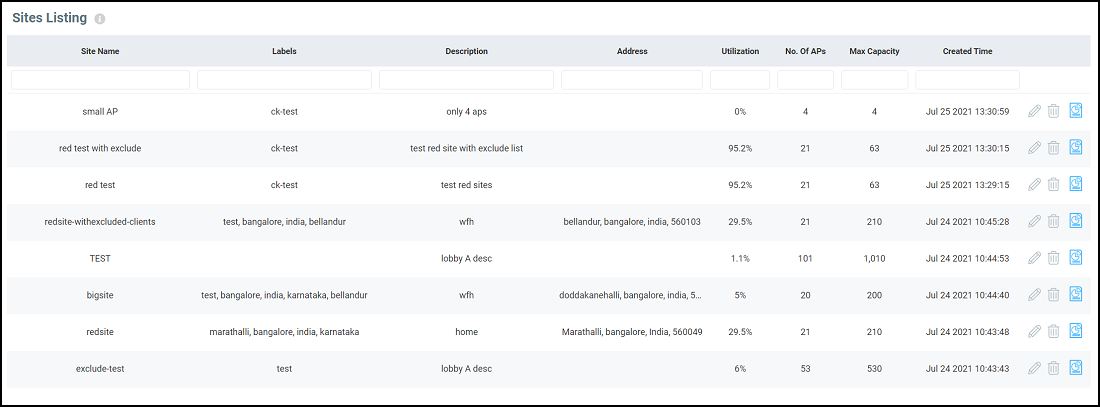
- Click Create. The site is created and displayed in the Sites Listing table.
You can view the occupancy details for specific site(s) with one or more labels from the top-right corner of the Occupancy page, using the All sites and All labels options.
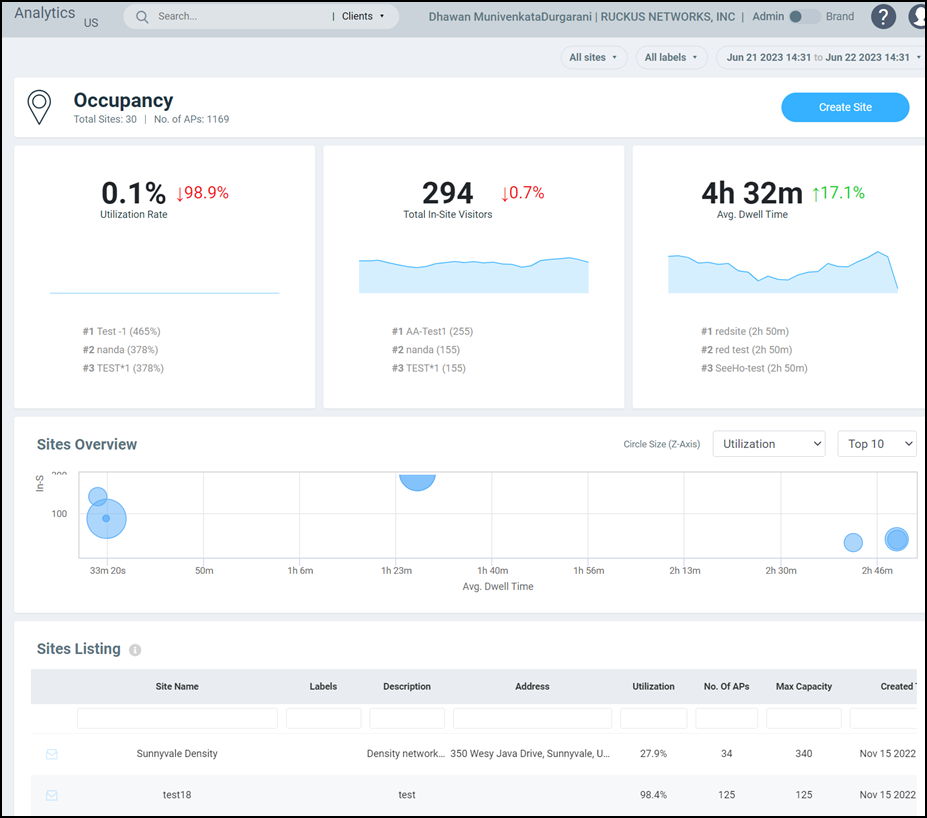
- Utilization tile
- Total In-Site Visitors tile
- Avg. Dwell Time tile
- Sites Overview chart
- Sites Listing table
Utilization Tile
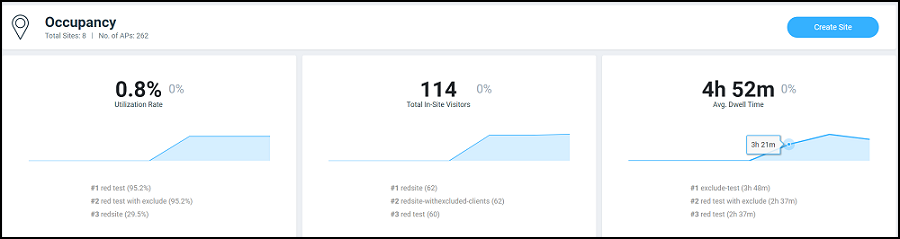
Total In-Site Visitors Tile
The Total In-Site Visitors tile displays the average number of visitors visiting the site and the increase or decrease in the number of in-site visitors from the previous time. An increase in average in-site visitors is displayed as a green number while a decrease is displayed as a red number. The Total In-Site Visitors tile also displays the top three clients visiting the site. A "visitor" is a device connected to an AP in the site with a unique MAC address.
Avg. Dwell Time Tile
The Avg. Dwell Time tile displays the average amount of time in minutes a device is connected to an AP in the site, and the increase or decrease in the dwell time from the previous time. An increase in average dwell time is displayed as a green number while a decrease is displayed as a red number. The Avg. Dwell Time tile also displays the top three clients with the highest dwell times in the site.
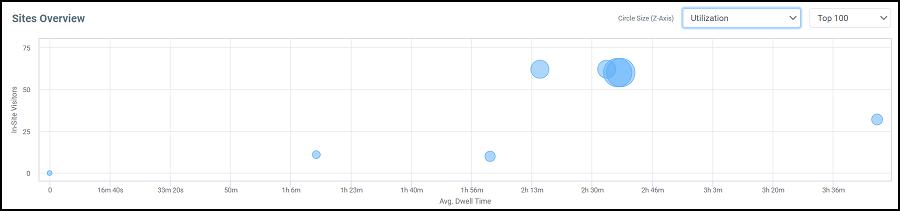
Sites Overview Chart
Sites Listing Table
 ). Click the Report icon (
 ) to
view the Site Report.
) to
view the Site Report.