Monitoring Wired Network Health
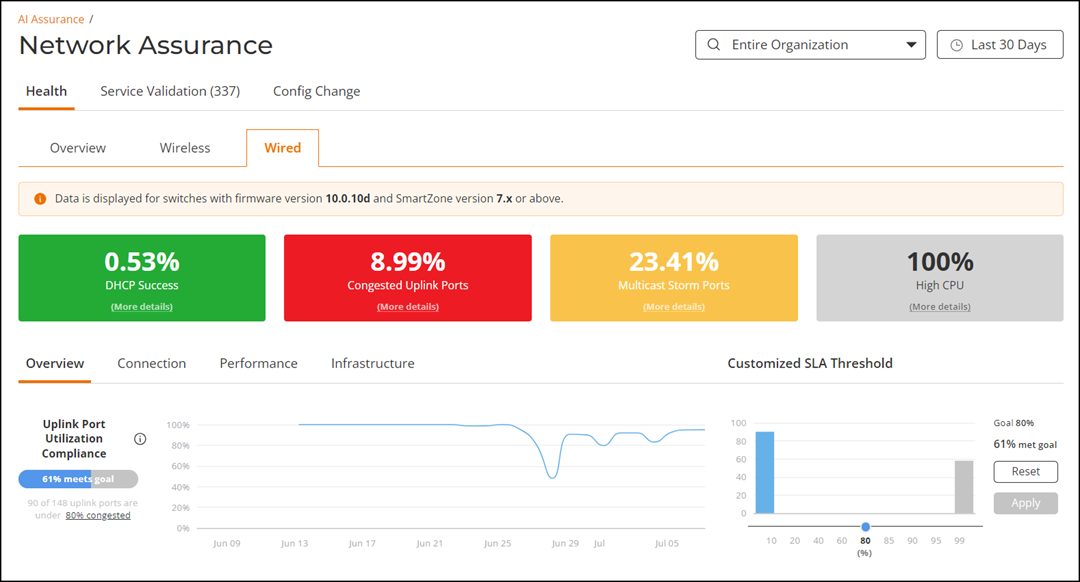
On the Health page, the Wired tab provides switch-related performance by giving insights into key metrics and showing aggregate values for critical network performance indicators.
On the Health page, the Wired tab is designed to facilitate KPI and service level agreement (SLA) tracking, allowing for real-time monitoring and management of network health. KPIs are organized into four categories: Overview, Connection, Performance, and Infrastructure. Each category provides access to specific health data relevant to the KPI metrics in each section, enabling you to pinpoint and address issues efficiently. Additionally, custom SLA thresholds can be configured for a subset of these KPIs, offering tailored monitoring and alerting based on specific network requirements.
Accessing the Health Page for Wired Network
The Network Hierarchy filter and Date and Time filter are displayed in the upper-right corner of the Content panel. These options control the elements displayed within the Content Panel. For more information, refer to Network Hierarchy Filter and Date and Time filter.
| KPI Category | Firmware Requirements - Switches Running FastIron Firmware Version | SmartZone Version |
|---|---|---|
Wired Network Health KPIs:
|
10.0.10f or later | 7.x or later |
Wired AI Infrastructure Health - Table compliance KPIs:
|
10.0.10h_cd1 or later | 7.x or later |
High-level Network Health Metrics
- DHCP Success: Displays
the percentage of successful DHCP bindings of clients that are connected to
the switches. A DHCP connection attempt is deemed successful when the device
has received an IP address from the DHCP server. It is possible for a single
device to have multiple DHCP connection attempts.
Click the More details option to access the DHCP sidebar that displays information about the top 5 switches with the highest DHCP failure rates in a donut chart and table that shows the Top 10 Impacted Switches.
The donut chart displays the distribution of switches with the highest number of DHCP failures. The table displays the details of impacted switches. You can access additional switch details by clicking the Name attribute in the table to view the switch report.
Top Switches with High DHCP Failure Rate 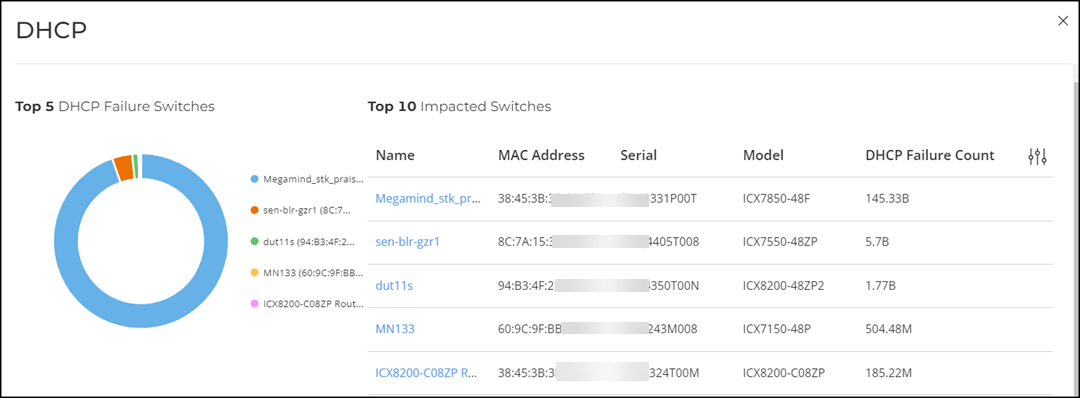
- Congested Uplink
Ports: Displays the percentage of network traffic effectively
transmitted through the uplink ports of wired switches. Click the More details
option to access the Uplink Usage sidebar that displays
information about the top 5 congested switches having the highest number of
congested ports in a donut chart and a table that shows the list of Impacted Uplink
Ports. You can access additional switch details by clicking the
Name attribute in the table to view the switch report.
Congested Switches with High Uplink Usage 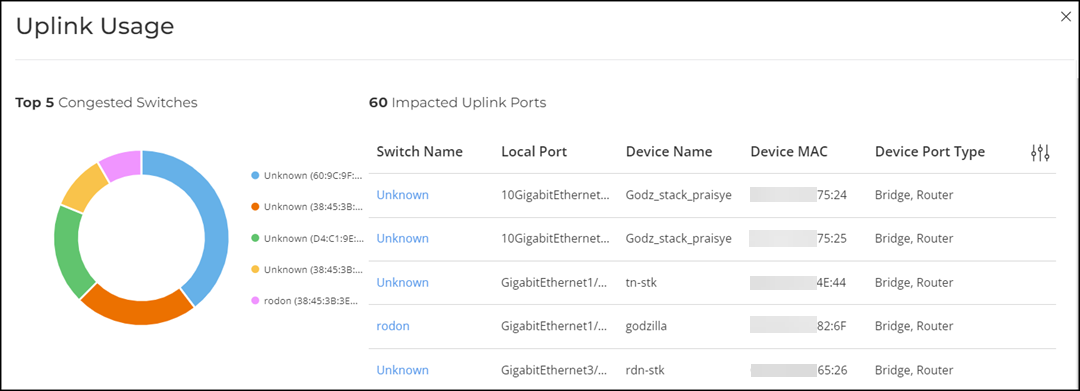
- Multicast Storm
Ports: Displays the percentage of ports experiencing
multicast storm, where the multicast traffic level exceeds the multicast
traffic threshold defined by the system. Click the More details option to access the Multicast Storm Ports sidebar that displays information about the top 5 storm switches having the highest number of uplink ports that have excessive amount of multicast traffic in a donut chart and a table that shows the list of Impacted Uplink Ports. You can access additional switch details by clicking the Name attribute in the table to view the switch report.
Switches with Ports Experiencing Multicast Storm 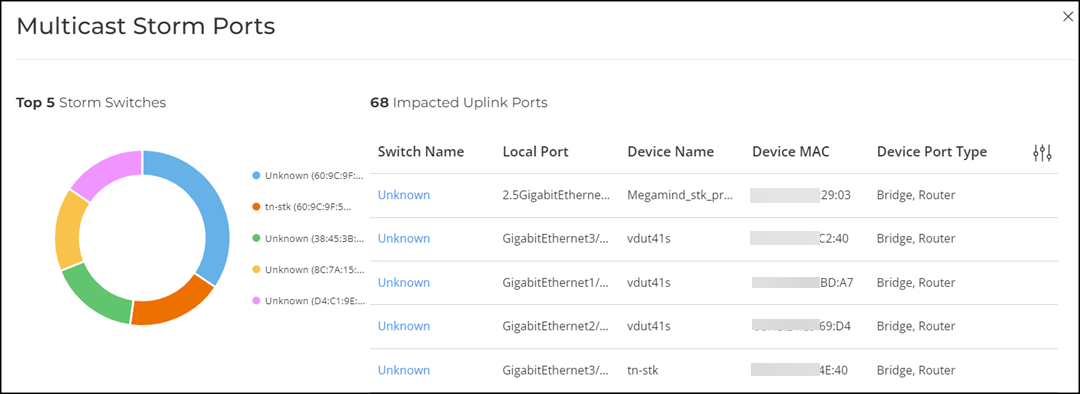
- High
CPU: Displays the percentage of switches with high CPU
utilization in the network. Click More details
option to access the High CPU sidebar that displays
information about the top 5 switches with the highest CPU usage in a donut
chart and table. The donut chart displays the distribution of switches with
the highest CPU usage and the table displays the details of impacted
switches. You can access additional switch details by clicking the
Name attribute in the table to view the switch report.
Switches with High CPU Usage 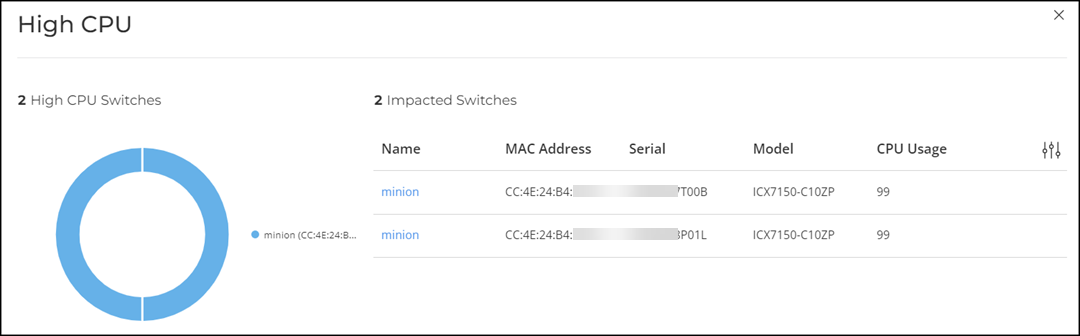
Health KPIs and SLAs
- Overview
- Connection
- Performance
- Infrastructure
Each category provides access to specific health data relevant to its KPIs. Additionally, custom SLA thresholds can also be configured for select KPIs, enabling tailored monitoring and alerting based on specific network requirements.
The content area is graphically divided into three sections: a pill-shaped box depicting the average percentage for the metric or specifying the success rate of the KPI metric meeting a threshold within the larger sample set, a time-series graph depicting the metric value in percentage over time, and a bar chart.
The time-series graph has an interactive element which allows you to zoom in on specific time period by dragging the mouse across the graph. You can click the Reset Zoom button to revert to the full time period based on the time range selected in the Date and Time filter at the top of the page. Note that the numbers related to the time-series graph will change as you zoom in or zoom out of a time range, and these changes are reflected in the pill-shaped box data. However, the bar chart on the right remains fixed based on the time range selected at the top of the page.
There are two types of bar charts: a view-only bar chart that provides information about the threshold trends, and another configurable bar chart that allows you to set the threshold for a metric. The threshold you set for the metric is the value against the goal. You can change the SLA threshold by adjusting the slider below the bar chart. As you change the goal, the percentage is recalculated. Click Apply to set the new threshold for the metric or click Reset to revert to the default threshold value.
SLA threshold changes cannot be saved at the Organization level. The Apply button remains disabled when Organization is selected. To save changes, select another network node from the network hierarchy filter.
Overview Tab
- Uplink Port Utilization
Compliance: Measures the amount of network traffic effectively
transmitted through the uplink ports of wired switches. It shows the percentage
of uplink ports that meet the configured congestion threshold. It also provides
information about the number of uplink ports operating in compliance with the
configured congestion threshold goal.
The time-series graph displays the percentage of uplink port utilization compliance over time, while the bar chart on the right shows the distribution of uplink port utilization across the number of ports relative to the configured SLA threshold.
- Switch
Reachability: Checks switch accessibility to the controller and
shows the percentage of switches that are reachable. Switch reachability is
determined based on whether switches are online and connected to the controller.
This metric provides an overall view of switch connectivity and indicates
potential connectivity issues.
The time-series graph displays the percentage of switch reachability over time, while the bar chart on the right shows the daily percentage of reachable switches over the last seven days of the selected time range.
Connection Tab
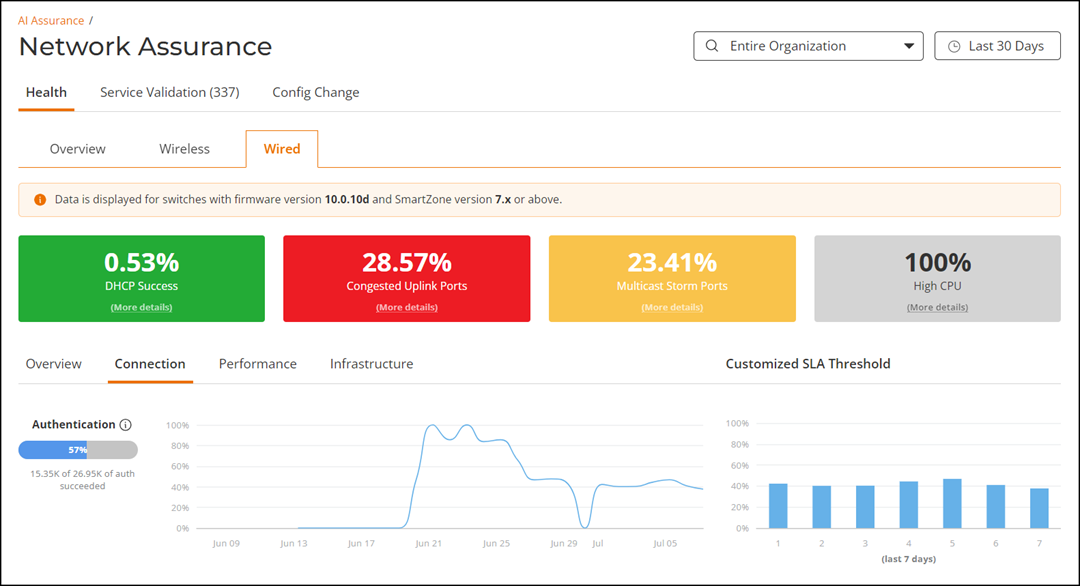
- Authentication: Measures the rate of successful
authentication events out of the total authentication attempts on network
devices. An authentication attempt is deemed successful when a device is
authenticated and granted access to the network. This metric tracks
authentication events, categorizing them into successful and failed attempts.
The time-series graph displays the percentage of successful authentication attempts over time. The bar chart on the right captures the daily percentage of successful authentications over the last seven days of the selected time range.
- DHCP: Measures the rate of
successful DHCP bindings relative to the total DHCP attempts made by the clients
connected to the switches. A DHCP connection attempt is deemed successful when
the device has received an IP address from the DHCP server. It is possible for a
single device to have multiple DHCP connection attempts. The KPI shows the
percentage of successful DHCP bindings of clients connected to switches.
The time-series graph displays the percentage of DHCP connection attempts that have completed successfully over time. The bar chart on the right captures the daily percentage of DHCP successful bindings over the last seven days of the selected time range.
Performance Tab
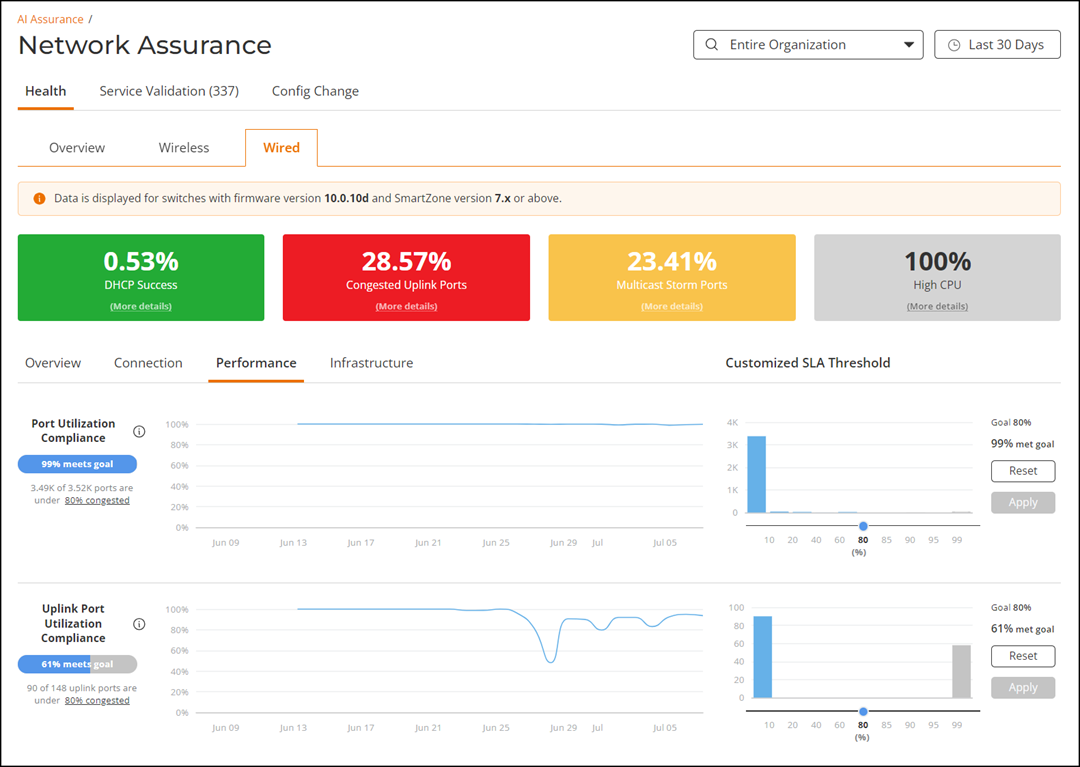
- Port Utilization Compliance:
Measures the amount of traffic effectively transmitted through the ports within
the network's capacity. It shows the percentage of ports that meet the
configured congestion threshold. It also provides information about the number
of ports operating in compliance with the configured congestion threshold goal.
The time-series graph displays the percentage of port utilization compliance over time, while the bar chart on the right shows the distribution of port utilization across the number of ports relative to the configured SLA threshold.
- Uplink Port Utilization
Compliance: Measures the amount of network traffic effectively
transmitted through the uplink ports of wired switches. It shows the percentage
of uplink ports that meet the configured congestion threshold. It also provides
information about the number of uplink ports operating in compliance with the
configured congestion threshold goal.
The time-series graph displays the percentage of uplink port utilization compliance over time, while the bar chart on the right shows the distribution of uplink port utilization across the number of ports relative to the configured SLA threshold.
- Interface Health Compliance:
Measures the compliance metric of ports without anomalies. Anomalies refer to
unexpected and abnormal network behavior, which can result from cable issues,
failed negotiations, MTU errors, and input errors, all contributing to poor user
experience.
The time-series graph displays the percentage of interface anomalies over time, while the bar chart on the right shows the daily percentage of interface anomalies over the last seven days of the selected time range.
- MC Traffic: Measures the
amount of multicast (MC) traffic received on the ports and shows the percentage
of ports that meet the MC traffic (packets/second) threshold. When multicast
traffic exceeds the configured threshold, it allows network administrators to
identify the traffic sources and take steps to reduce (throttle) the traffic
generated by specific applications or clients.
The time-series graph shows the percentage of MC traffic in the network over time, while the bar chart on the right displays the distribution of MC traffic across the number of ports relative to the configured SLA threshold.
Infrastructure Tab
- System: Contains device-level KPI metrics, offering insights into how system components such as switch reachability, memory, CPU, temperature, and PoE utilization are performing relative to defined compliance thresholds. These metrics help monitor the overall health and stability of infrastructure hardware.
- Table: Contains compliance metrics derived from routing and forwarding tables. These include compliance checks for unicast and multicast route tables, ARP tables, and MAC address tables. These KPIs provide visibility into how efficiently the device is managing address resolution, routing, and traffic forwarding entries.
These KPI metrics enable proactive monitoring of infrastructure performance and resource utilization across the wired network.
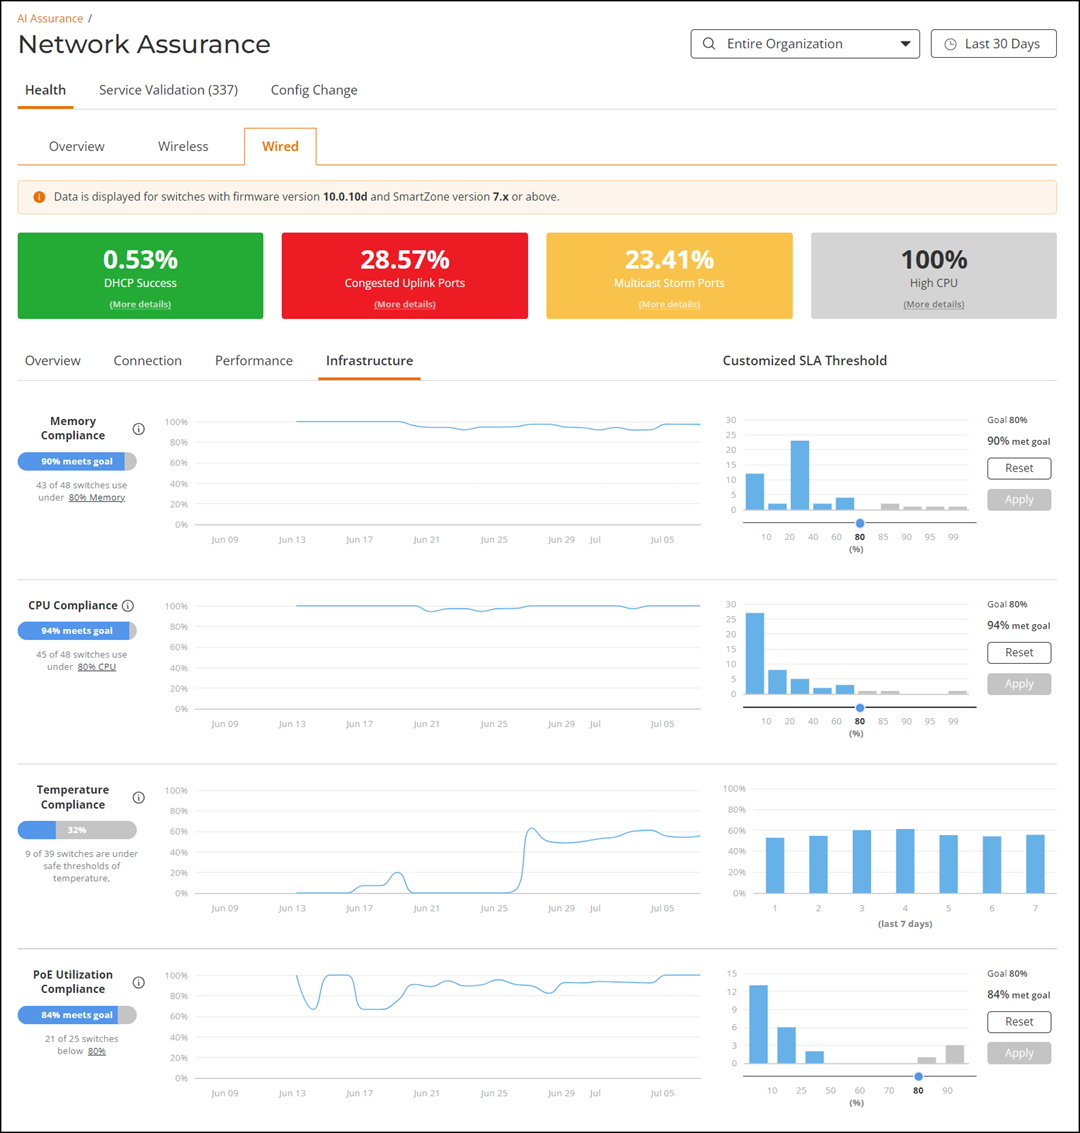
Wired AI Infrastructure Health - System Compliance KPIs
The System tab displays information on switch reachability, memory compliance, CPU compliance, temperature compliance, and PoE utilization compliance KPI metrics.
- Switch Reachability: Refer to Overview Tab.
- Memory Compliance: Measures the percentage of switches in
the network with memory utilization below the specified threshold. This metric
indicates the number of switches that are compliant with the predefined limit
set in the SLA that specifies the acceptable level of memory utilization for
switches.
The time-series graph displays the percentage of switches with memory utilization below the threshold over time. The bar chart on the right shows the distribution of switches within different ranges of memory utilization relative to the configured SLA threshold.
- CPU Compliance: Measures the percentage of switches in the
network with CPU utilization below the specified threshold. This metric
indicates the number of switches that are compliant with the predefined limit
set in the SLA that specifies the acceptable level of CPU usage.
The time-series graph displays the percentage of switches with CPU utilization below the threshold over time. The bar chart on the right shows the distribution of switches within different ranges of CPU utilization relative to the configured SLA threshold.
- Temperature Compliance: Measures the percentage of switches
within safe temperature operating conditions.
The time-series graph displays the percentage of switches within safe temperature operating conditions over time. The bar chart on the right displays the daily percentage of switches within safe temperature operating conditions over the last seven days.
- PoE Utilization Compliance: Measures the percentage of
switches in the network consuming power within the allocated budget. This metric
indicates the number of switches that are compliant with the predefined limit
set in the SLA that specifies the acceptable level of PoE utilization. The time-series graph displays the percentage of switches with PoE utilization below the configured threshold over time. The bar chart on the right displays the distribution of switches within different ranges of PoE utilization relative to the configured SLA threshold.Note: The PoE Utilization Compliance KPI metrics under Wired Network Health is applicable for switches running FastIron firmware version 10.0.10f or later. However, PoE Utilization Compliance KPI metrics under Wireless Network Health is applicable for switches running any FastIron firmware version.
Wired AI Infrastructure Health - Table Compliance KPIs
The Table tab displays information about IPv4 unicast table compliance, IPv6 unicast table compliance, IPv4 multicast table compliance, IPv6 multicast table compliance, ARP table compliance, and MAC table compliance KPI metrics.
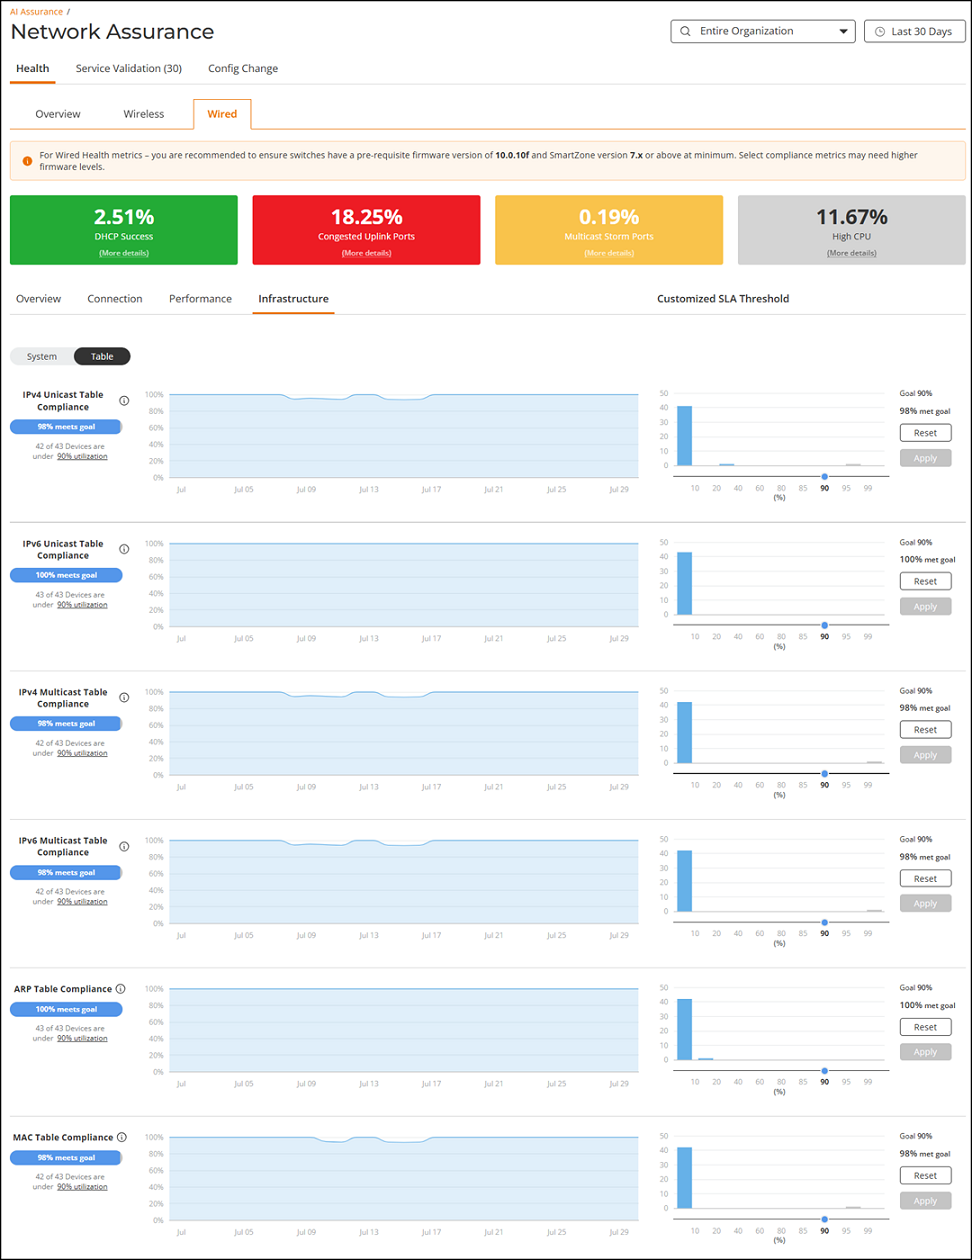
- IPv4 Unicast Table
Compliance: Measures the percentage of switches that maintain
IPv4 unicast route table utilization within the configured SLA threshold. The
IPv4 unicast route table plays a critical role in determining the optimal path
for forwarding packets to their destinations, based on factors such as subnet,
next hop, metric, interface, and administrative distance.
It shows the percentage of switches that meet the configured table utilization threshold. It also provides information about the number of switches operating in compliance with the defined SLA goal for route table usage.
Monitoring this KPI helps ensure that the table does not exceed its capacity, which could otherwise lead to performance degradation, packet loss, or intermittent connectivity issues due to rejected new entries or overutilized system resources.
The time-series graph displays the compliance trend over time, showing the percentage of switches operating within the defined threshold. The bar chart on the right visualizes the distribution of route table utilization across switches, helping identify potential saturation risks relative to the SLA goal.
- IPv6 Unicast Table
Compliance: Measures the percentage of switches that maintain
IPv6 unicast route table utilization within the configured SLA threshold. The
IPv6 unicast route table is essential for determining the optimal forwarding
path based on destination address, prefix length, next hop, metric, outgoing
interface, and administrative distance. Compared to IPv4, these tables handle
longer address formats and leverage updated routing protocols tailored for IPv6
environments.
It shows the percentage of switches that meet the configured table utilization threshold. It also provides information about the number of switches operating in compliance with the defined SLA goal for IPv6 route table usage.
Monitoring this KPI helps prevent issues caused by route table saturation, such as packet drops, increased CPU and memory utilization, and instability in unicast-based applications. Staying within the defined threshold ensures network performance and service continuity.
The time-series graph displays the compliance trend over time, showing the percentage of switches operating within the threshold. The bar chart on the right visualizes the distribution of IPv6 route table utilization across switches, helping identify systems nearing capacity limits relative to the SLA goal.
- IPv4 Multicast Table
Compliance: Measures the percentage of switches that maintain
IPv4 multicast route table utilization within the configured SLA threshold. The
IPv4 multicast route table enables efficient delivery of packets from a single
source to multiple destinations, supporting use cases like live video streaming,
financial market data feeds, and online multiplayer gaming.
It shows the percentage of switches that meet the configured table utilization threshold. It also provides information about the number of switches operating in compliance with the defined SLA goal for multicast route table usage.
Monitoring this KPI helps ensure uninterrupted multicast service delivery. When the multicast table reaches capacity, new entries are rejected, leading to degraded performance, increased switch resource usage, and potential instability in multicast-dependent applications.
The time-series graph displays compliance trends over time, showing the percentage of switches operating within the defined utilization threshold. The bar chart on the right illustrates the distribution of multicast table usage across switches, relative to the SLA goal. - IPv6 Multicast Table
Compliance: Measures the percentage of switches maintaining IPv6
multicast route table utilization within the configured SLA threshold. The IPv6
multicast route table facilitates efficient distribution of packets from a
single source to multiple destinations, supporting use cases like media
streaming, financial data delivery, and online gaming—optimized for IPv6 address
formats and enhanced routing protocols.
It shows the percentage of switches that meet the configured utilization threshold. It also provides information about the number of switches operating in compliance with the defined SLA goal for IPv6 multicast table usage.
Monitoring this KPI helps ensure service continuity for multicast applications. When the table reaches capacity, switches may reject new multicast route entries, resulting in degraded performance, increased resource usage, and network instability for multicast-dependent services.
The time-series chart displays compliance trends over time, highlighting the percentage of switches within the configured utilization threshold. The SLA distribution chart shows the spread of IPv6 multicast table usage across the switch population relative to the SLA goal. - ARP Table Compliance:
Measures the percentage of switches maintaining Address Resolution Protocol
(ARP) table utilization within the configured SLA threshold. The ARP table maps
IP addresses to MAC addresses, enabling devices to locate each other on the same
network and communicate efficiently.
It shows the percentage of switches that meet the configured utilization threshold. It also provides information about the number of switches operating in compliance with the defined SLA goal for ARP table usage.
Monitoring this KPI helps prevent communication disruptions for new devices. When the ARP table reaches capacity, switches are unable to store new IP-to-MAC address mappings, leading to degraded performance, increased CPU load, and network instability or intermittent connectivity issues.
The time-series chart displays compliance trends over time, highlighting the percentage of switches within the configured utilization threshold. The SLA distribution chart shows the spread of ARP table usage across the switch population relative to the SLA goal. - MAC Table Compliance:
Measures the percentage of switches maintaining Media Access Control (MAC) table
utilization within the configured SLA threshold. The MAC table maps device MAC
addresses to the corresponding switch ports, allowing the switch to forward
frames to the correct destination efficiently.
It shows the percentage of switches that meet the configured utilization threshold. It also provides information about the number of switches operating in compliance with the defined SLA goal for MAC table usage.
Monitoring this KPI helps prevent potential network disruptions. When the MAC table reaches capacity, the switch is unable to learn new MAC addresses and may start flooding incoming frames across all ports in the VLAN. This not only degrades performance but also opens the network to MAC flooding attacks, leading to data interception and congestion.
The time-series chart displays compliance trends over time, highlighting the percentage of switches within the configured utilization threshold. The SLA distribution chart shows the spread of MAC table usage across the switch population relative to the SLA goal.