Health
The Health page offers a comprehensive end-to-end overview of the network health, encompassing both wireless and wired components. It provides critical insights into key performance indicator (KPI) metrics offering varying levels of data sampling and tracks Service Level Agreements (SLAs) for various network elements. It automatically monitors network health relative to configurable SLA thresholds. Setting SLA thresholds tailored to specific network requirements ensures that network components meet the required performance standards, helping maintain service quality and reliability. By presenting real-time data on network health and behavior, the Health page enables you to effectively monitor and manage network infrastructure.
You can evaluate network health based on various thresholds, known as goals, which you are allowed to set. For example, you can set a goal of five seconds for all clients to connect to the network and monitor in real time the number of clients meeting this five-second goal. This allows you to determine the metric for clients connecting within the set time and identify those experiencing delays. The success rate of network elements in meeting each goal is typically displayed as a percentage of the metric.
Accessing the Health Page
- Overview tab: Displays data from both wireless and wired network components. For more information, refer to Health - Overview Tab.
- Wireless tab: Displays aggregate connection metrics and individual KPI metrics (charts with their SLAs) for the wireless network. For more information, refer to Monitoring Wireless Network Health.
- Wired tab: Displays aggregate metrics and individual KPI metrics (charts with their SLAs) for the wired network. For more information, refer to Monitoring Wired Network Health.
Network Hierarchy Filter
- Overview tab: The network hierarchy drill-down is available from Entire Organization down to the Domain level.
- Wireless tab: The network hierarchy drill-down is available from Entire Organization down to individual APs. The network hierarchy selection for this tab inherits the selection from the Overview tab, but you can modify it as needed.
- Wired tab: The network hierarchy drill-down is available from Entire Organization down to individual Switches. The network hierarchy selection for this tab inherits the selection from the Overview tab, but you can modify it as needed.
The Network Hierarchy filter provides flexible and detailed control over the network data displayed, allowing you to focus on specific network segments for monitoring and analysis.
For more information on how to apply the filter, refer to Content Panel.
Date and Time filter
The Date and Time filter, displayed in the upper-right corner of the Health page, allows you to control or modify the scope of data displayed on the content panel. You can view elements within the content panel based on the selected time period.
The Date and Time filter allows you to display data for the Last 24 Hours, Last 7 Days, or Last 30 Days. By default, Last 24 Hours option is selected. Each date range offers different levels of granularity: data for the past 24 hours is sampled every 4 hours, the 7-day view provides daily granularity, and the 30-day view is based on data points sampled every 5 days. To modify the date range, refer to Content Panel.
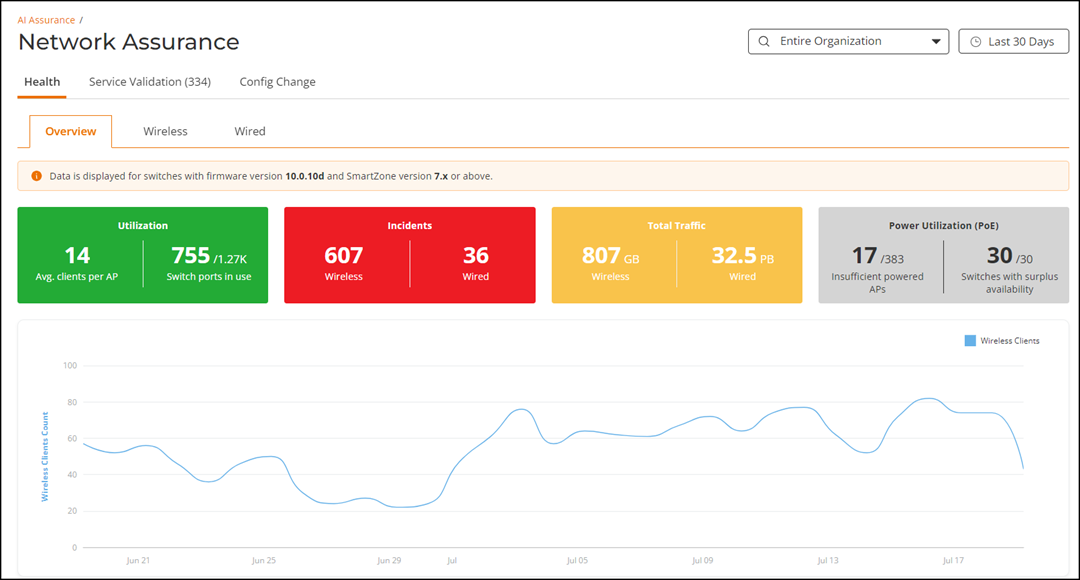
Health - Overview Tab
The Overview tab integrates data from both wireless and wired network components, offering a holistic view of the entire network.
- Utilization: Provides insights into the
effectiveness of network resources usage.
- Average clients per AP: Displays the average number of client devices connected to APs in the network.
- Switch ports in use: Displays the number of switch ports with UP status compared to the total number of switch ports available in the network.
- Incidents: Provides insights into the number of
reported issues that have occurred across the wired and wireless portions of
the network, aiding in network health monitoring, performance optimization,
and proactive maintenance. Tracking incidents separately for APs and
switches helps in pinpointing the specific areas of the network that are
experiencing issues, allowing for targeted troubleshooting and resolution.
- Wireless: Displays the number of incidents related to APs and other wireless infrastructure in the network.
- Wired: Displays the number of incidents related to switches in the network.
- Total
Traffic: Provides insights into the amount of data
transmitted across the wired and wireless portions of the network. This
metric is divided into separate values for wired and wireless traffic,
giving a comprehensive view of overall data flow and network usage patterns.
It helps to assess how the data load is distributed between the two types of
network infrastructure.
- Wireless: Displays the amount of data transmitted through the network's wireless connections. It includes traffic handled by APs and other wireless infrastructure.
- Wired: Displays the amount of data sent and received through the uplink ports of the network switches.
- Power Utilization
(PoE): Provides insights into the power usage and adequacy of
power supply to network devices. This includes monitoring the distribution
of PoE power across devices, identifying devices with insufficient power,
and recognizing switches with surplus power availability, to ensure optimal
network performance and reliability.
- Insufficient powered APs: Displays the number of APs that do not receive sufficient power to operate effectively out of the total number of APs. This could affect their performance, range, and reliability. Insufficient power to APs can lead to reduced signal strength, limited coverage, and poor network performance.
- Switches with surplus availability: Displays the number of switches that have excess PoE power available or have a higher power budget than what is currently being utilized by connected devices, out of the total number of PoE-enabled switches. This surplus power can be used to support additional PoE devices or to provide more power to existing devices.
The time-series graph at the bottom of the page displays the historical count of both wireless and wired clients, facilitating simultaneous visualization of the two metrics. The graph uses color-coding and a double Y-axis to display both the Wireless Clients Count (left Y-axis) and Wired Clients Count (right Y-axis), while the X-axis represents the timeline. This configuration helps in identifying trends, correlations, and patterns between the number of wired and wireless clients over time.
The graph has an interactive element which allows you to zoom in on a specific time period by dragging your cusrsor across the graph. You can click the Reset Zoom button to revert to the full time period based on the time range selected in the Date and Time filter at the top of the page.