Switch Insights
The Switch Insights page page provides detailed, time-range-based analytics and operational information for the selected switch.
- On the navigation bar, select . The Switch List page is displayed.
- Click Switch Name attribute of the selected switch. The Switch Incidents and Insights page is displayed.
- Click Insights tab to
view the details.
Switch Insights Page (Upper Portion Only) 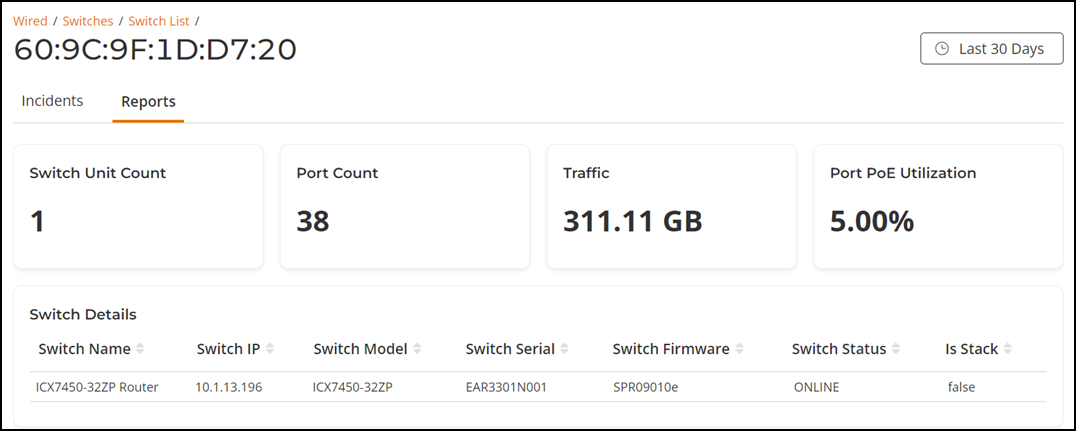
- Overview tile
- Switch Details table
- Top Ports By Traffic tile
- Traffic by Usage tile
- Resource Utilization tile
- Uptime History tile
- LLDP Neighbor List table
The data displayed on this page is based on the selected date and time range. Use the Date and Time filter in the upper-right corner to select a predefined time range or configure a custom date and time range. For more information, refer to Content Panel.
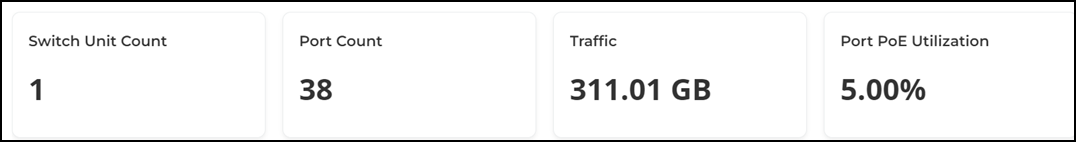
Overview Tile
The Overview tile provides a general overview of the selected switch and displays the switch unit count, port count, traffic, and port PoE utilization for the selected time period in the Date and Time filter.
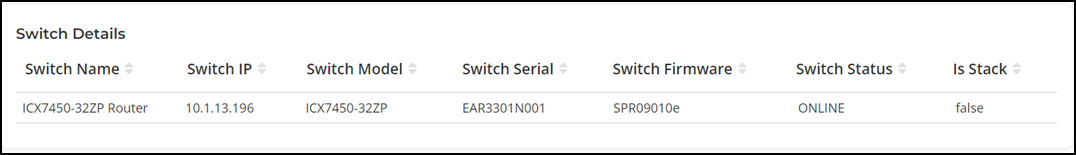
Switch Details Table
The Switch Details table displays attributes such as switch name, switch IP, switch model, switch serial, switch firmware, switch status, and Is stack information about the selected switch for the selected time period in the Date and Time filter.
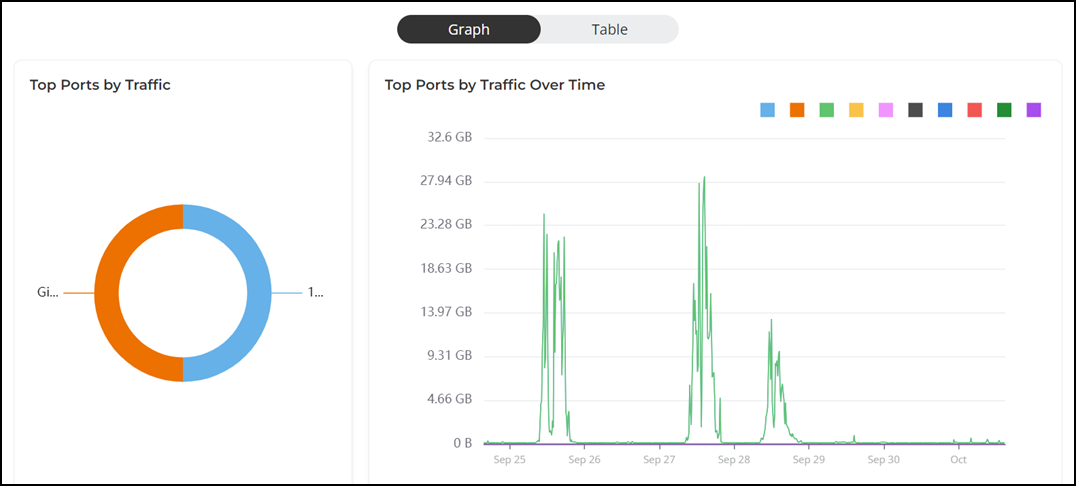
Top Ports By Traffic Tile
The Top Ports By Traffic tile contains two panes Top Ports By Traffic and Top Ports By Traffic Over Time.
The Top Ports By Traffic pane displays a donut chart. The donut chart display the ports that have generated the largest volume of traffic over this switch for the selected time period in the Date and Time filter. Pausing the pointer over the chart displays an information box with the details of the selected port.
The Top Ports By Traffic Over Time pane displays a graph. The graph display the ports that have generated the largest volume of traffic over this switch for the selected time period in the Date and Time filter. Pausing the pointer over the graph displays an information box with the ports details at that time and date. Click any of the colored squares to hide the selected ports in the graph. The information icon that is hidden is displayed in gray.
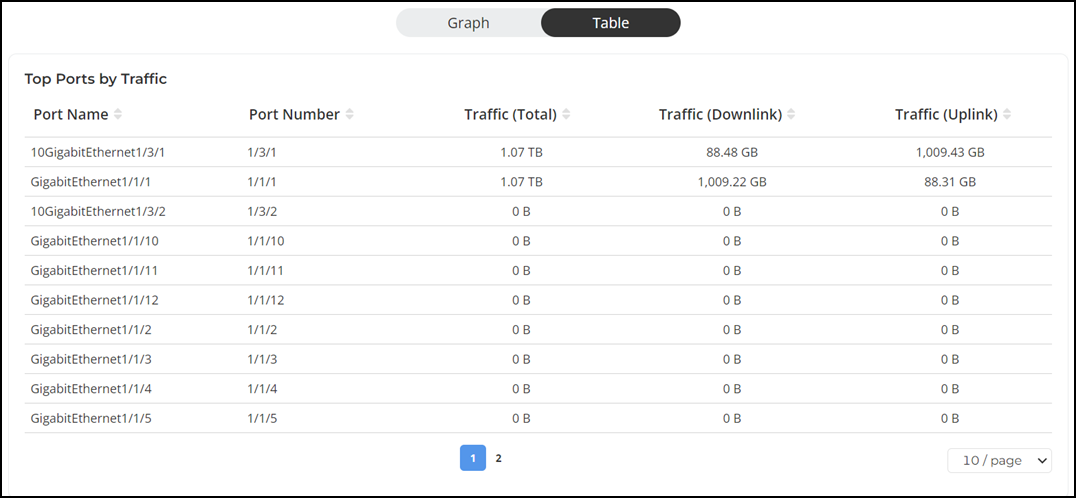
To view all the ports, click the Table option. The table is displayed with the ports name, port number, total traffic, total downlink traffic, total uplink traffic for the selected time period in the Date and Time filter. You can select the number of ports displayed in the table from the drop down at the bottom of the table.
Use the graph and table icons to toggle between the chart and table views.
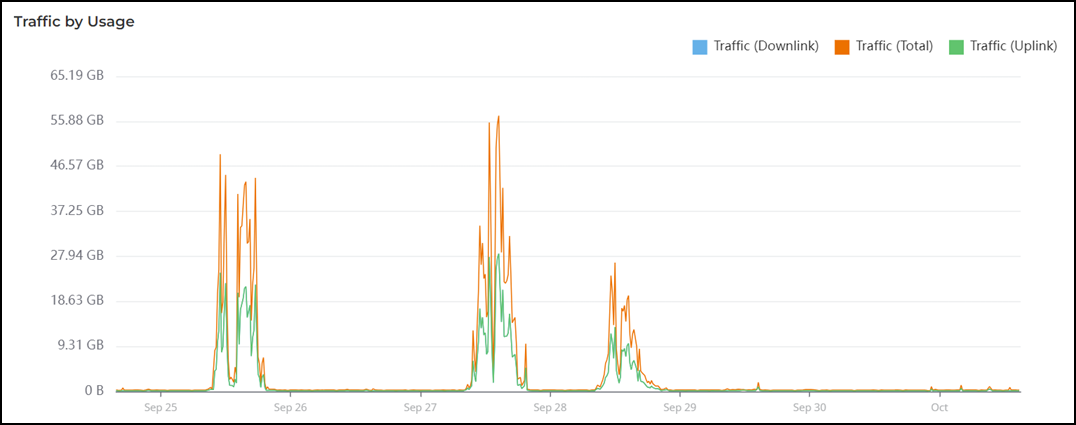
Traffic by Usage Tile
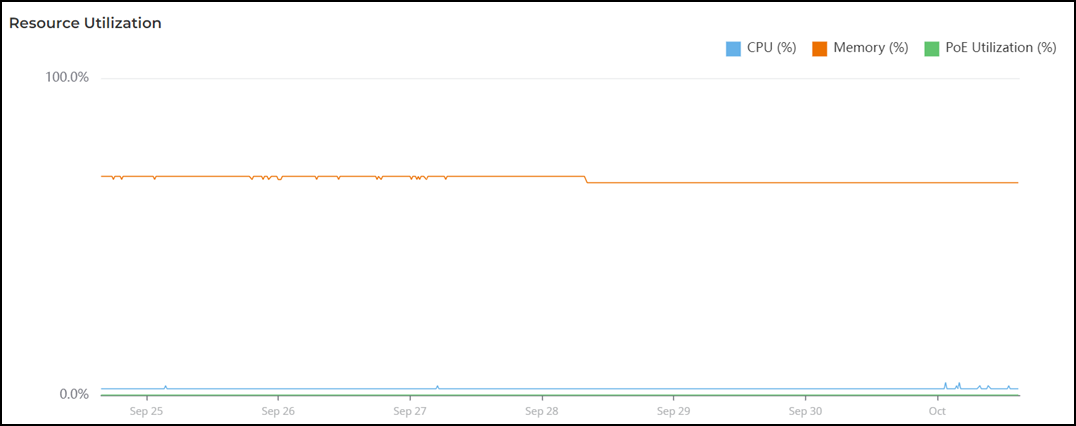
Resource Utilization Tile
The Resource Utilization tile contains a graph that displays the CPU, memory, and PoE utilization percentages for the selected switch for the selected time period in the Date and Time filter. Pausing the pointer over the graph displays an information box with the CPU, memory, and PoE utilization percentages at that time and date. Click any of the colored squares to hide the selected CPU, memory, or PoE utilization in the graph. The information icon that is hidden is displayed in gray.
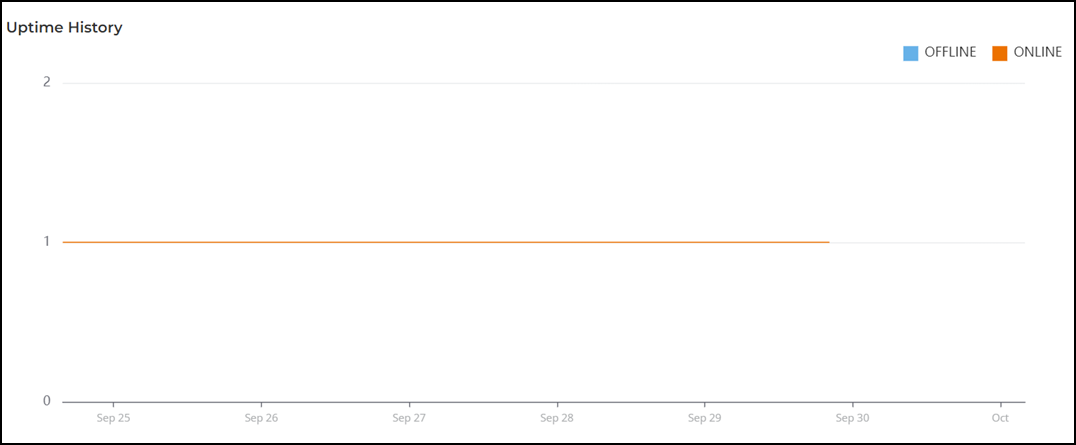
Uptime History Tile
The Uptime History tile contains a graph that displays the online and offline status of the selected switch over time for the selected time period in the Date and Time filter. Pausing the pointer over the graph displays an information box with the online and offline status at that time and date. You can hide any of this information displayed in the graph by clicking the Online or Offline icon at the top of the graph. The information icon that is hidden is displayed in gray.
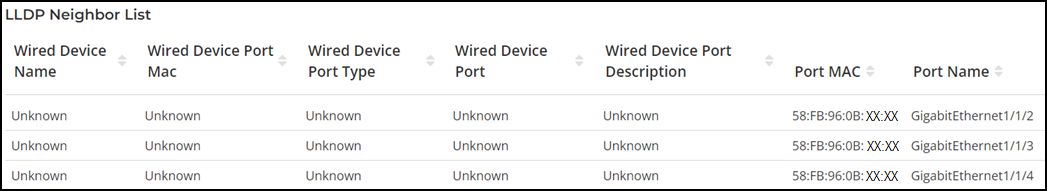
LLDP Neighbor List Table
The LLDP Neighbor List table of the Switch Details report provides information about all the LLDP neighbors of the specified switch.
The LLDP Neighbor List table displays information about all the LLDP neighbors of the selected switch for the selected time period in the Date and Time filter. The table displays attributes such as wired device name, wired device port MAC, wired device port type, wired device port, wired device port description, port MAC, and port name. You can select the number of ports displayed in the table from the drop down at the bottom of the table.