Viewing Activities and Events on a Network Timeline
You can view activities and events for a selected Wi‑Fi network to monitor network operations and troubleshoot issues.
-
Click the
Timeline tab.
The Activities sub-tab is displayed with the following information:
- Date: Displays the date and time (as a hyperlink) of the activity. Click the hyperlink to view the activity details in the Activity Details sidebar.
- Status: Displays the activity status.
- Product: Displays the product associated with the activity (for example, Wi‑Fi).
- Source: Displays the name or email address associated with the user that triggered the activity.
- Description: Displays details of the activity, including the network name and associated venue, when available.
You can use the Search option to display only the entries matching the specified Source and Description; enter a minimum of two characters. Additionally, you can filter the list by selecting options from the Status drop‑down list. The statuses include Pending, In progress, Success, Failed or Partial Success.
You can customize which fields appear in the table by clicking the
 icon and selecting or deselecting the desired column names. Drag and drop
individual column names up or down the list to customize the left‑to‑right
column display in the table. Optionally, you can click Reset to
default to restore the default subset of columns.
icon and selecting or deselecting the desired column names. Drag and drop
individual column names up or down the list to customize the left‑to‑right
column display in the table. Optionally, you can click Reset to
default to restore the default subset of columns. Click Clear Filters to remove all applied filters and restore the complete list of activities. You can sort the list by clicking the associated column header.
Click the icon to update the table with the most recent activity data. The
Auto
Refresh toggle automatically refreshes the table at regular
intervals when enabled, ensuring that the displayed activity information
remains current without a manual refresh.
icon to update the table with the most recent activity data. The
Auto
Refresh toggle automatically refreshes the table at regular
intervals when enabled, ensuring that the displayed activity information
remains current without a manual refresh.Timeline - Activities Sub-Tab 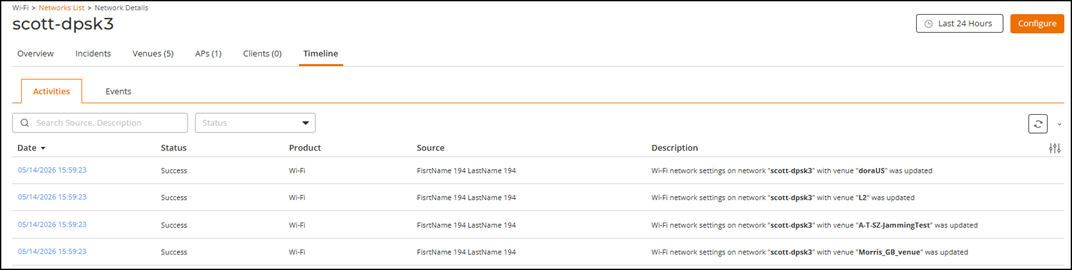
-
Click the Events sub-tab to
view events associated with the selected network.
The Events tab displays a list of events for the selected time range. Review the following information:
- Date: Displays the date and time (as a hyperlink) when the event occurred. Click the hyperlink to view the event details in the Event Details sidebar.
- Severity: Displays the severity of the event (Critical, Major, Minor, Warning, or Informational). Refer to Event Severity Levels for more information.
- Event Type: Displays the category of the event. Refer to Event Types for more information.
- Product: Displays the product category related to the event.
- MAC Address: Displays the MAC address of the client device associated with the event.
- Source: Displays the identifier of the client or system entity that generated the event.
- Description: Displays a brief description of the event.
The description includes dynamic details such as the client identifier,
event action (for example, connection or disconnection), and the service
network name. The network name is displayed as a hyperlink for quick
navigation to the corresponding network details.
You can customize which fields appear in the table by clicking the
icon and selecting or deselecting the
desired column names. Optionally, you can click Reset to
default to restore the default subset of columns.
Click Clear Filters to remove all applied filters and
restore the complete list of events. You can sort the list by
clicking the associated column header. You can use the Search field to display only table entries that match the specified Source or Description; enter a minimum of two characters. Additionally, you can refine the list of events by selecting options from the Severity, Event Type, and Product drop‑down lists. The severity filter options are Critical, Major, Minor, Warning, and Informational. The event type filter includes AP, Security, Client, Network, IoT Controller, and Optical.
Click the
icon to reload the latest events. The
Auto
Refresh toggle automatically refreshes the table at
regular intervals when enabled, ensuring that the displayed event
information remains current without a manual refresh.Timeline - Events Sub-Tab 
-
(Optional) Click the
 icon to export the displayed events as a .csv file for offline
analysis.
icon to export the displayed events as a .csv file for offline
analysis.