Getting to Know the Dashboard

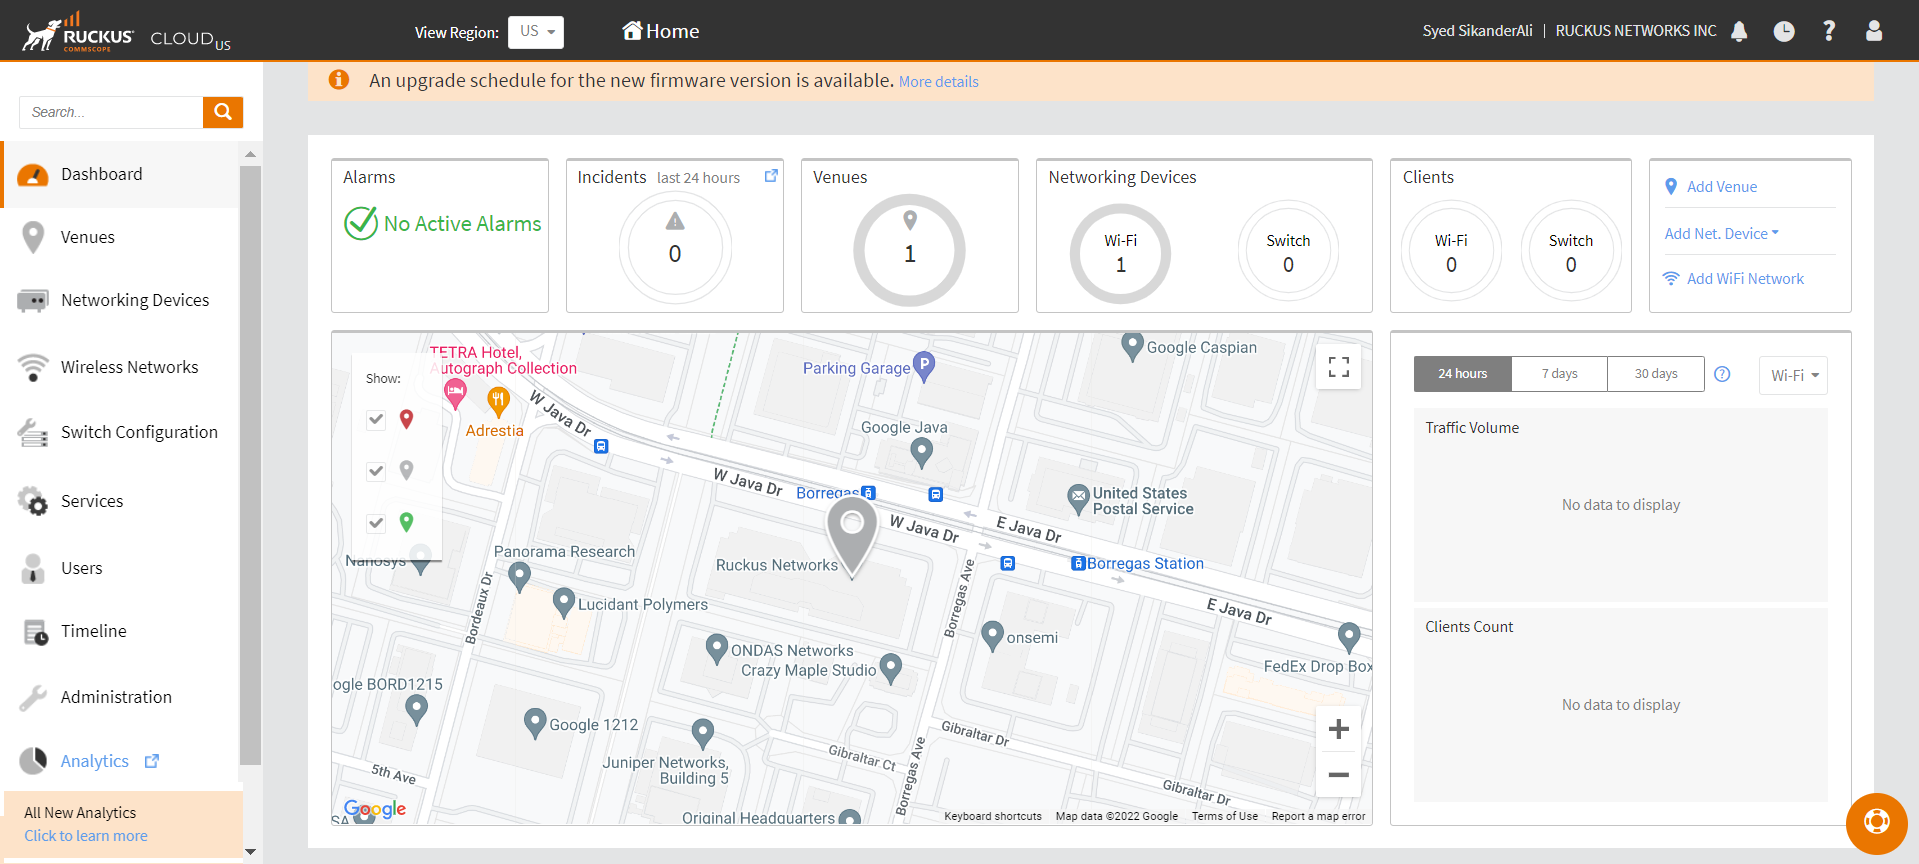
The Dashboard, which is the first page that appears after your log on to the RUCKUS Cloud portal, provides a snapshot of your networks, venues, access points, and wireless clients associated with your access points.

Dashboard: A Snapshot of Your Networks
Table 1. Dashboard Elements
Number Box Name Description
1 Alarms

Shows the number of uncleared alarms that have been generated on your Ruckus Cloud networks. When no alarms have been generated, the message No Active Alarms appears in the Alarms box.

  • To view details of the uncleared alarms, including when the alarm occurred, alarm type, and alarm source, click the double-down caret icon in the bottom-right corner of the Venues box.
  • To clear an alarm from the summary table, click the down-arrow icon after New, and then click Clear This Alarm.
Clearing an Alarm
  • Green indicates that everything is operating normally.
  • Red indicates that some issues have been found. Click the double-down caret icon at the end of the status message to learn more about the issues.
  • Yellow indicates that the wireless network service is degraded. Click the double-down caret icon at the end of the status message to learn more about the issue or issues causing the degradation.
2 Venues Shows the number of venues that have been configured in your Ruckus Cloud account.
  • To view a summary of the venues, including their locations, description, networks, number of APs, and number of active clients, switches, and switch clients, select a venue listed under Venue.
  • To edit a venue, select a venue and click Edit in the upper-left corner of the page.
  • To delete a venue, select a venue and click Delete in the upper-left corner of the page.
  • To add a venue, click Add Venue in the upper-right corner of the page.
3 Networking Devices Shows the number of networking devices (Wi-Fi APs and Switches) that have been added to the Ruckus Cloud account.

The Networking Devices page has two tabs: WiFi and Switch

  • To view a summary of the networking devices, including their names, statuses, models, IP addresses, serial numbers, MAC addresses, venues in which they are deployed, mesh roles, number of active clients, select an AP or switch.
  • To view or edit the settings of a venue, click the venue name on the summary table.
4 Clients Shows the number of WiFi clients currently connected to managed APs, and the number of the clients connected to a switch.
  • To view a summary of the number of Wi-Fi and Switch clients, including their MAC addresses names and host names, click the double-down caret icon in the bottom-right corner of the Clients box.
5 Essential shortcuts Shows shortcuts for the following basic tasks:
  • Add Venue: Click to open the screen for adding a venue, and then following the instructions in Adding a Venue.
  • Add a Networking Device: Click to open the screen for adding a networking device Switch or Wi-Fi AP and then follow the on-screen instructions.
  • Add Network: Click to open the screen for adding a network, and then follow the instructions in Add Network and Creating Networks Overview.
6 Map Displays venue location markers within the Google map.
Note: References to the name of an object managed by the Ruckus Cloud portal (Venue, AP, Switch, Network, Client) display in blue to represent a link to the detail page of the object. For example, the MAC address under the Alarms on the dashboard links to the AP details page.

Color-coding of Numbers for Venues, APs, Switches, and Clients

The segmented color lines around the numbers of venues, APs, switches and clients indicate the statuses of the venues, APs, and switches.