Viewing the Wired Service Validation Test Report
The Service Validation test report page provides detailed insights into the outcome of a service validation test. It presents both a summarized view and detailed per-switch results, enabling you to analyze network service availability and identify issues across different service checks.
The report breaks down the validation process into multiple service checks (DHCP, DNS, ping, and traceroute), helping isolate the point of failure or degradation within the network.
- On the navigation bar, select . The Service Validation page is displayed, defaulting to the Wireless sub-tab.
- Select the Wired sub-tab. A list of configured service validation tests is displayed.
- Click the hyperlinked name of a specific test. The Overview page for the selected service validation test is displayed.
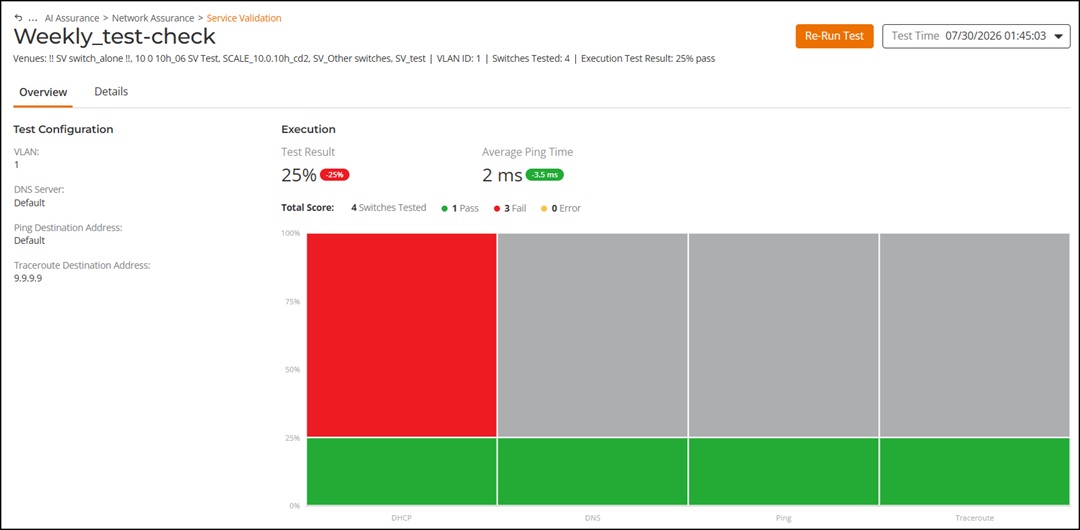
The header panel displays the test name along with the contextual information about the test configuration and the overall success percentage of the test.
Click Re-Run Test to conduct the test again with the same configuration. The Test Time field displays previously executed test instances.
Click the Test Time drop-down to display a log of all the previously conducted tests with details such as test date and time, number of switches under test, count of Pass, Fail, and Error results. Click the Test Time attribute to display the corresponding report.
- Overview
- Details
Overview Tab
By default, the Overview tab is displayed. It provides a summarized view of the test configuration and execution results.
- Test Configuration pane: The Test Configuration pane displays the configuration used for the test such as VLAN, DNS server (Default/Custom), Ping destination address, and Traceroute destination address.
- Execution pane: The
Execution pane displays key metrics such as the
execution test result percentage, representing the proportion of switches
that passed all executed service checks, and the average ping time,
indicating the average latency across successful ping tests.
The Total Score attributes display the overall test outcome for switches under test, including the count of switches with Pass, Fail, and Error results. The overall switch result is determined as follows:
- Pass: A switch is marked as Pass when all executed connection stage tests complete successfully.
- Fail: A switch is marked as Fail when one or more connection stage tests are unsuccessful.
- Error: A switch is marked as Error when a test stage cannot be executed because of system, configuration, or connectivity issues.
A stage-wise bar chart provides a visual representation of the test outcomes across service checks such as DHCP, DNS, ping, and traceroute. Each bar displays the percentage distribution of switches with Pass, Fail, Error, or NA results for the corresponding service check. NA indicates that a service check is not supported for the current configuration or scenario and therefore is not executed. For example, Service Validation in DHCP Server mode is not fully supported in all scenarios. The DHCP service check will be reported as NA when Service Validation is executed in DHCP Server mode for an unsupported scenario.
Pausing the cursor over the graph displays an information box with the test score details for each service check.
Details Tab
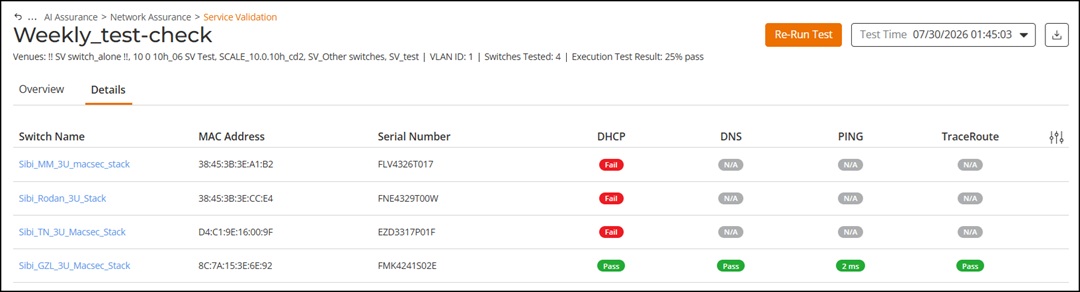
- Switch Name: Displays the name of the switch. Click the hyperlinked switch name to view the details about the switch.
- MAC Address: Displays the MAC address of the switch.
- Serial Number: Displays the serial number of the switch.
- DHCP: Displays the status of the DHCP validation.
- DNS: Displays the status of the DNS resolution test.
- Ping: Displays the status of the ping test. The response time is also displayed (in ms) for successful tests.
- Traceroute: Displays that status of the traceroute test.
Pause the cursor over a status indicator to view additional details about the result.