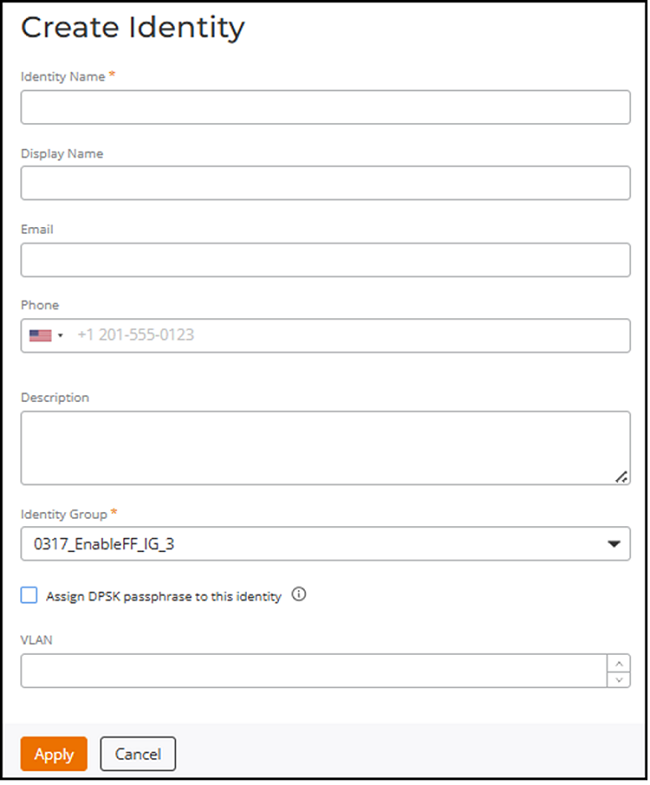
Adding an Identity
From the RUCKUS One web interface, you can configure the identity. You can assign a VLAN and Identity Group to the connected client. It is recommended that you create a Identity Group before you create an identity.
You can click an identity name in the list to view the identity details page. The Overview tab provides a comprehensive view of an identity, including its details, performance, connected devices, traffic, and application usage.
- Identity Health: Provides an aggregated view of the
connection quality and performance of all devices associated with an
identity. It displays the following metrics:
- Time to Connect: Displays the average
percentage of successful Wi-Fi connections across all clients that
meet the SLA threshold configured in the AI Assurance
Health page.
This metric measures the time taken for each client to complete key connection stages such as 802.11 authentication, association, Layer 2 authentication, and DHCP IP assignment. Time taken for Layer 3 authentication is excluded.
- Client Throughput: Displays the average
percentage of Wi-Fi sessions across all clients that have a client
throughput that meet the configured SLA threshold configured in the
AI Assurance Health page.
This metric measures the downlink throughput estimate of the client, taking into consideration RF channel conditions, interference, channel contention, and client capabilities.
- Time to Connect: Displays the average
percentage of successful Wi-Fi connections across all clients that
meet the SLA threshold configured in the AI Assurance
Health page.
- Traffic: Displays the total volume of user traffic for devices associated with an identity, including both transmitted (Tx) and received (Rx) data. The data is visualized in a donut chart segmented into Tx and Rx, with the overall traffic volume displayed at the center.
- Top 10 Applications by Traffic Volume: Displays the top 10 applications based on traffic consumption for devices associated with the Identity. The list shows each application along with its corresponding traffic volume for a detailed usage breakdown. Data is also visualized in a donut chart, segmented by applications, with the total traffic volume displayed at the center.
-
Associated Devices: Displays the total number of devices linked to an identity. The data is visualized in a donut chart, with the overall device count displayed at the center. This count includes both currently and previously connected devices.