Access Points Report
The Access Points Report page provides detailed information about the APs connected to the network.
From the navigation bar, select . Alternate path, , click View on the Access Points tile. The Access Points reports page is displayed.
- Overview tile
- Top APs By Offline Duration tile
- AP Count Trend tile
- AP Status tile
- AP Status Trend tile
- Top AP Models tile
- Top AP Software Versions tile
- Top AP Reboot Reasons tile
- Top AP Reboot Reasons Over Time tile
- Top APs by Reboot Count tile
- Top AP Alarm Types tile
- Top AP Alarm Types Over Time tile
- AP Details for Online/Offline Status table
Some of the tiles have the option to view the report in graphs and tables. The Graph and Table icons are displayed on top of the applicable tiles. By default, in those tiles, the reports are displayed in graphical format. If you want to view the report in table format, click the Table icon.
The top right corner of the Access Points Report pages display options to share and export reports in PDF and CSV formats. You can also share them with recipients over e-mails on-demand or periodically by configuring a schedule (daily, weekly and monthly). To download or create a schedule, refer to Navigating the RUCKUS One Portal.
The network node filter and Date and Time filter are displayed in the upper-right corner of the Content panel. These options control the elements displayed within the Content Panel. To modify these options, refer to Navigating the RUCKUS One Portal.
Overview Tile
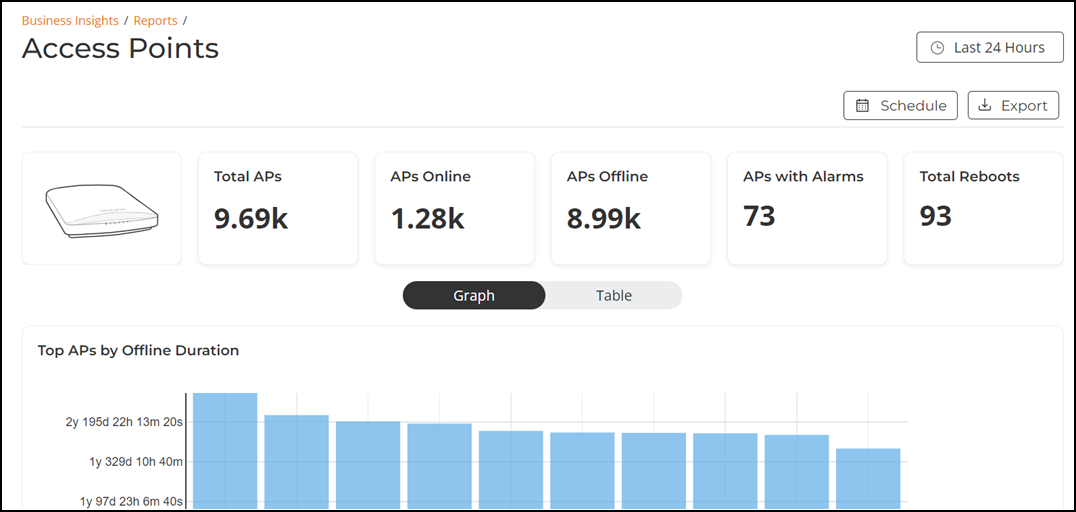
The Overview tile provides a general overview of the APs on the network and displays the count of total APs, APs online, APs offline, AP with Alaram, and total reeboots for the selected time period in the Date and Time filter.

Top APs by Offline Duration Tile
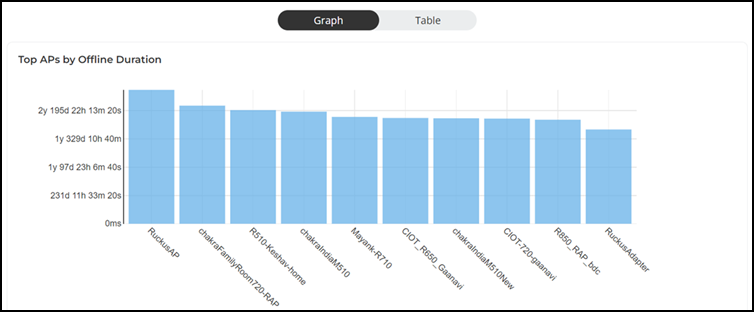
The Top APs by Offline Duration tile contains a donut chart and a table. The donut chart displays the top 10 APs in the network that have been disconnected for the longest duration for the selected time period in the Date and Time filter. Pausing the pointer over the chart displays an information box with the maximum offline duration details of the selected AP. All the offline APs are displayed in a table in the APs by Offline Duration pane. The table is displayed with the AP name, MAC, internal IP, location, model, and maximum offline duration. In the table, you can select the number of APs displayed in the tile from the drop down at the bottom of the table.
AP Status Tile
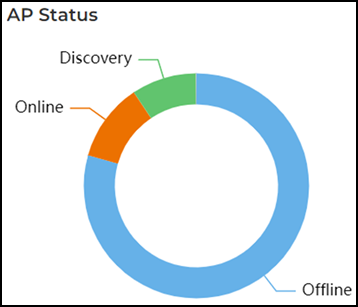
The AP Status tile contains a donut chart that displays the top APs by connection and uptime status, such as online, offline, provisioned, discovery, and other classifications for the selected time period in the Date and Time filter. Pausing the pointer over the chart displays an information box with the details of the selected AP.
AP Status Trend Tile
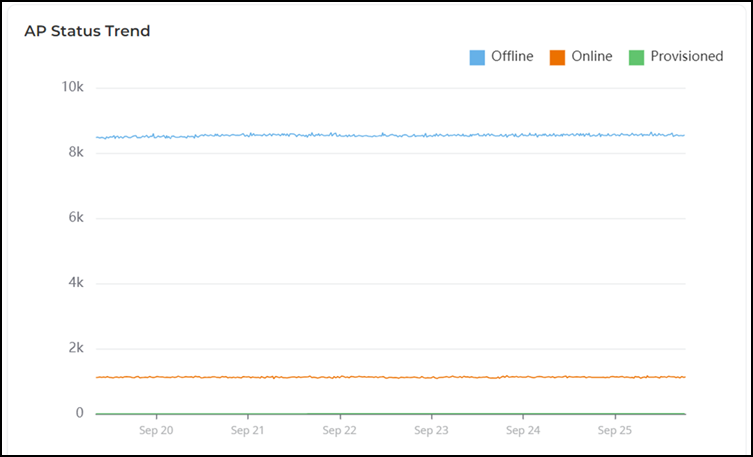
The AP Status Trend tile contains a graph that displays the count of APs that are online, offline, and provisioned for the selected time period in the Date and Time filter. Pausing the pointer over the graph displays an information box with the online, offline, and provisioned at that time and date. You can hide any of this information displayed in the graph by clicking the Online, Offline, or Provisioned icon at the top of the graph. The information icon that is hidden is displayed in gray.
Top AP Models Tile
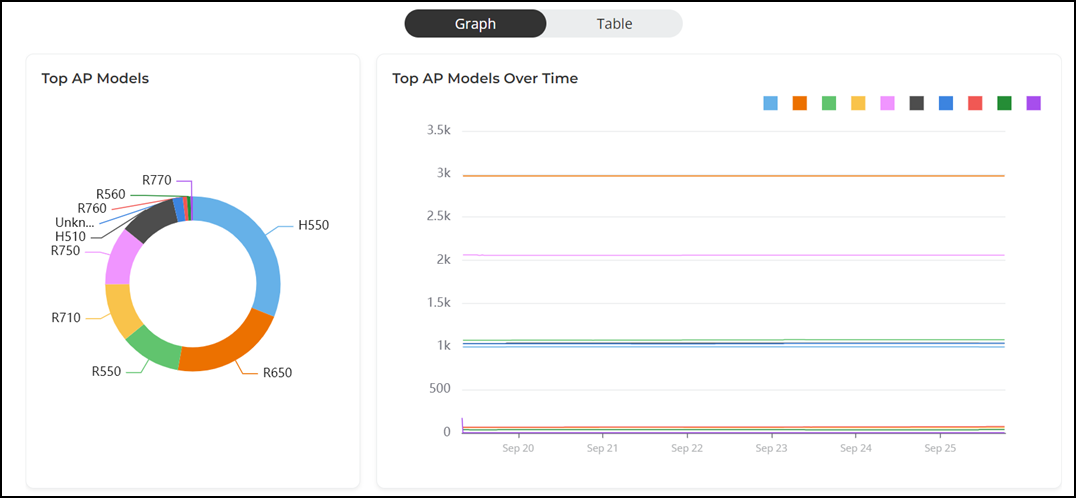
The Top AP Models tile contains two panes Top AP Models and Top AP Models Over Time.
The Top AP Models pane displays a donut chart. The donut chart display the top 10 AP model type that is most often used in your network for the selected time period in the Date and Time filter. Pausing the pointer over the chart displays an information box with the details of the selected AP model.
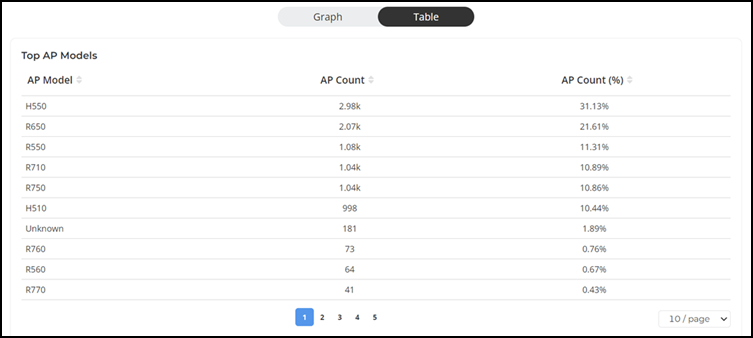
To view all the AP models, click Table icon. The table is displayed with the AP model, count, and count percentage information for the selected time period in the Date and Time filter. You can control the number of AP models displayed in the tile by selecting All, 10 per tile, or 20 per tile options from the drop down at the bottom of the tile.
Top AP Software Versions Tile
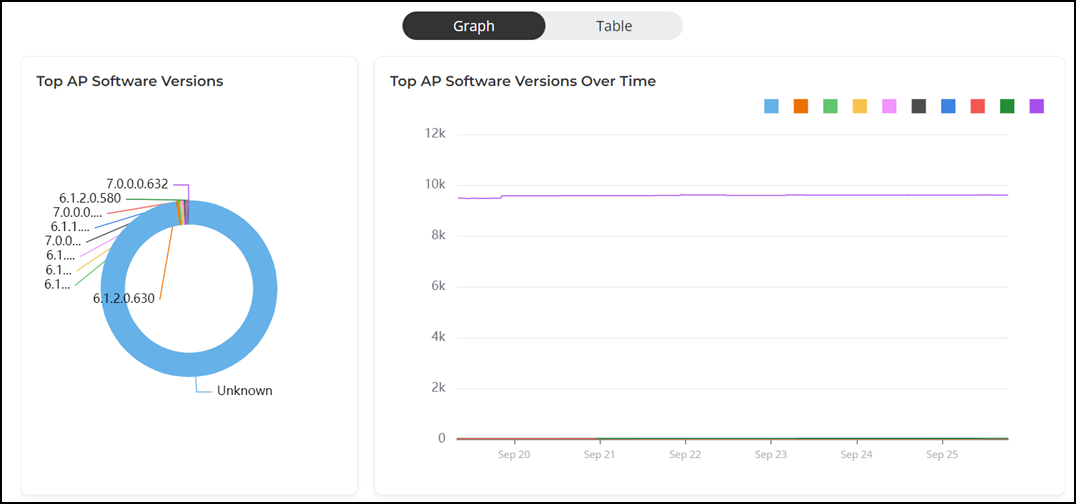
The Top AP Models tile contains two panes Top AP Software Versions and Top AP Software Versions Over Time.
The Top AP Software Versions pane displays a donut chart. The donut chart display the top 10 most-used AP software versions in your network, along with the count of APs using each software versions for the selected time period in the Date and Time filter. Pausing the pointer over the chart displays an information box with the details of the selected software versions.
The Top AP Software Versions Over Time pane displays a graph. The graph display the top 10 AP most-used AP software versions in your network, along with the count of APs using each software versions for the selected time period in the Date and Time filter. Pausing the pointer over the graph displays an information box with the details of the selected AP software versions along with the count of APs using each software versions at that time and date. Click any of the colored squares to hide the selected software versions in the graph. The information icon that is hidden is displayed in gray.
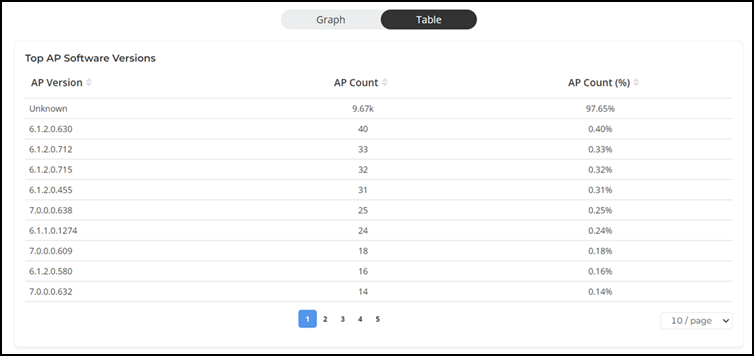
To view all the AP software versions, click Table icon. The table is displayed with the AP version, count, and count percentage information for the selected time period in the Date and Time filter. You can control the number of AP software versions displayed in the tile by selecting All, 10 per tile, or 20 per tile options from the drop down at the bottom of the tile.
AP Details for Online/Offline Status Table
The AP Details for Online/Offline Status table displays its status details based on AP name, MAC, Internal IP address, location, model name, and connection status for the selected time period in the Date and Time filter. You can control the number of APs displayed in the table from the drop down at the bottom of the table. The range is from 10 APs per tile to 200 APs per table.
