RUCKUS Edge Applications Report
The RUCKUS Edge Applications report reflects statistics based on the predefined applications that are accessed by the network clients.
From the navigation bar, select , then click View on the RUCKUS Edge Applications tile. The Edge Applications page is displayed.
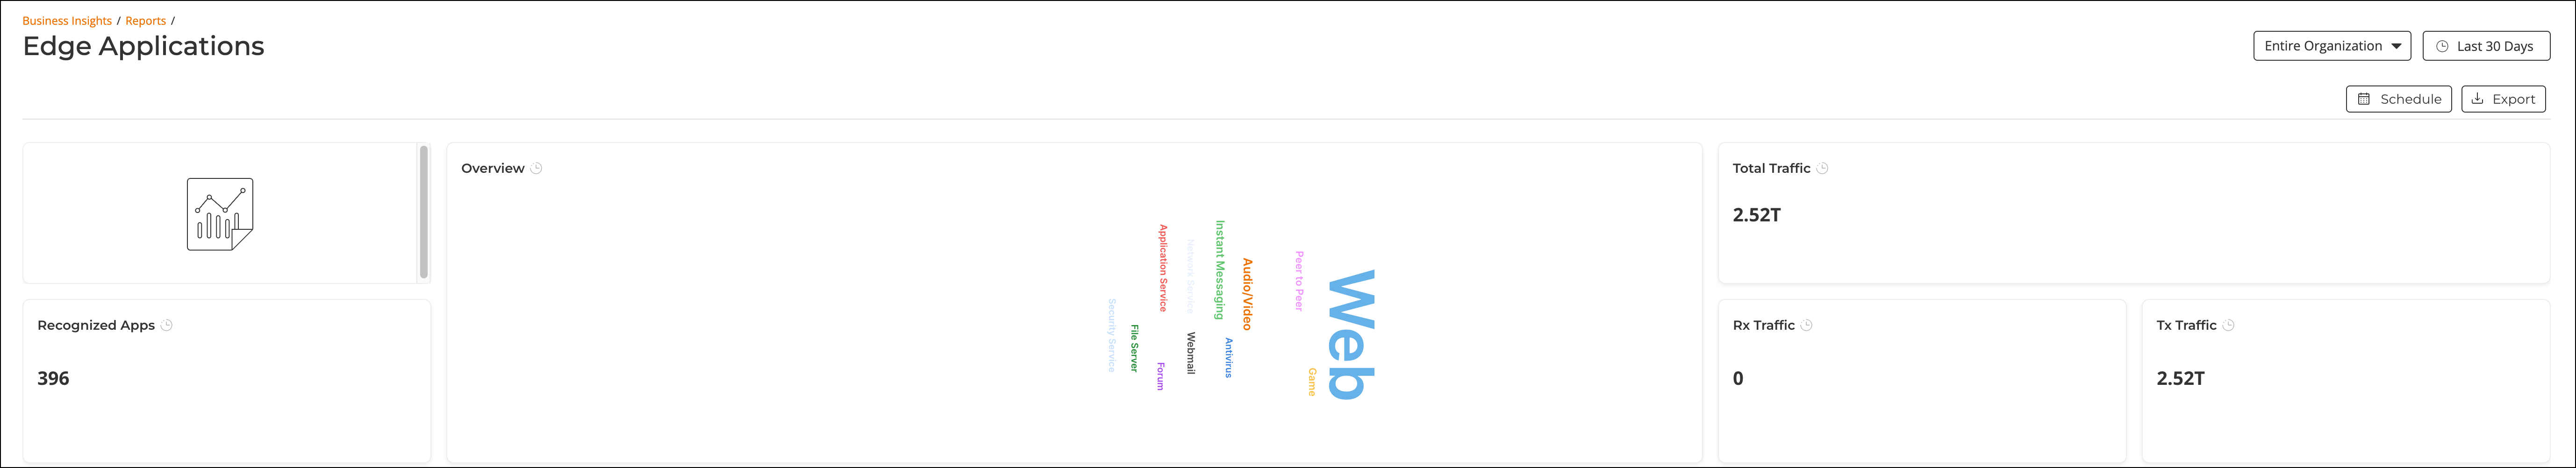
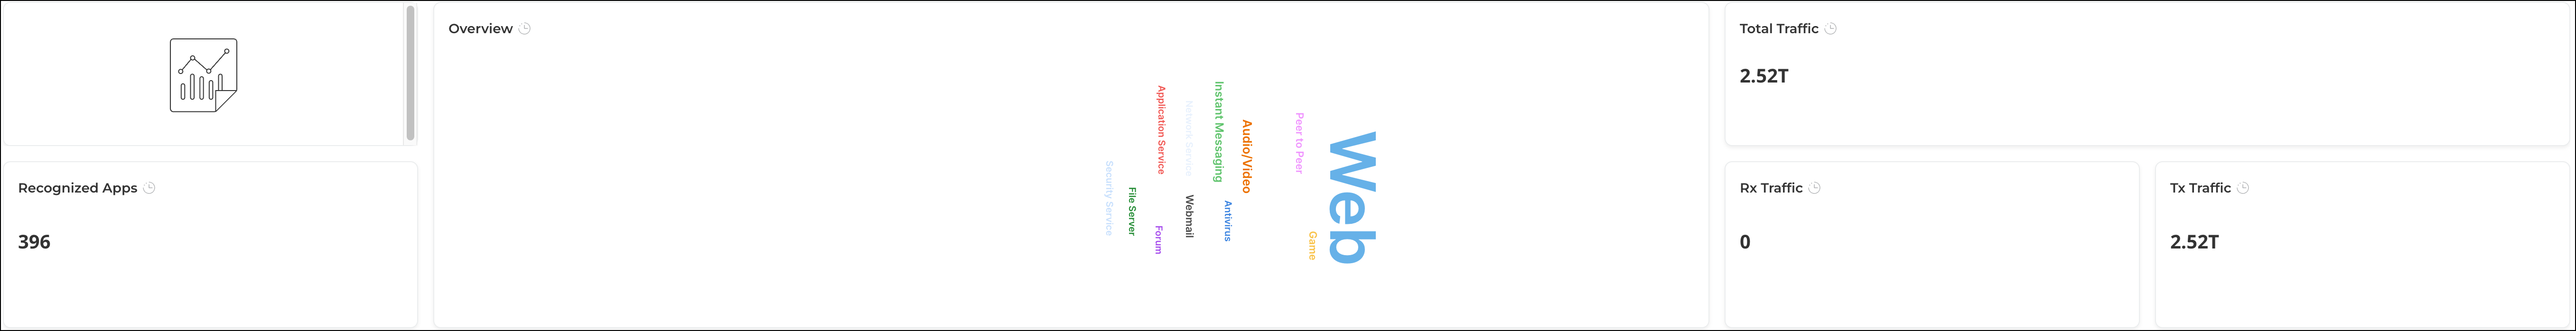
The Edge Applications page contains the details of the applications accessed by the network clients and predefined by RUCKUS Edge. The upper portion of the report displays tiles reflecting the total number of recognized apps, a word cloud listing all the application categories in which the apps reside, and the amount of application traffic (total, uplink (Rx), and downlink (Tx)).
- Top ten applications by traffic volume received and transmitted.
- Top ten applications by client count.
- Top ten app categories by traffic and client count.
You can display these data per your needs, filtering by recognized or unrecognized type and displaying as either tables or graphs.
All tiles contain a gray *clockimage* icon next to the tile name, providing a helpful reminder the data is historical and not real-time.
- Overview tile
- Top Applications by Traffic tile
- Top Applications by Client Count tile
- Top Apps by Traffic vs. Client Count with AP Count tile
The top right corner of the Applications Report pages displays the Export options to share and export reports in PDF and PNG formats. Using the Schedule option, you can also share the reports with recipients over e-mails on-demand or periodically by configuring a schedule (daily, weekly, and monthly).
- Entire Organization or choose a specific venue from the list.
- Last 24 Hours, Last 7 Days, or Last 30 Days, or select a date from the calendar.
At-a-Glance App Metrics
The upper portion of the RUCKUS Edge Applications report provides an overview of all applications recognized by the application-recognition engine and the traffic volumes that these applications consume for the selected network node and time period.
At a glance, you can view displays the following information:
- The number of recognized applications
- A list of all the application categories in which the apps reside (displayed as a word cloud)
- Total traffic
- Total uplink (Rx) traffic
- Total downlink (Tx) traffic
Top Applications by Traffic Tile
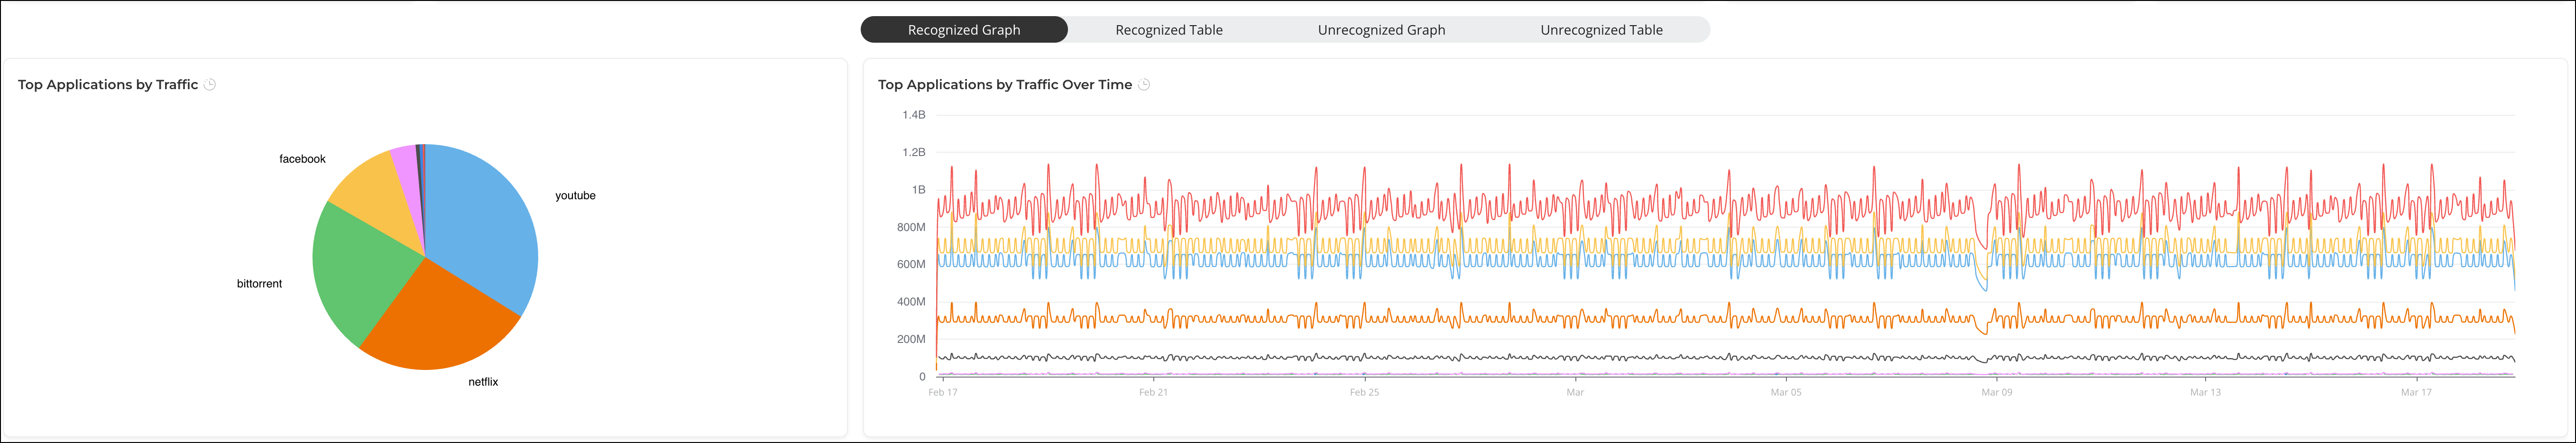
- Recognized Graph: Displays statistics of traffic from recognized applications in a graph.
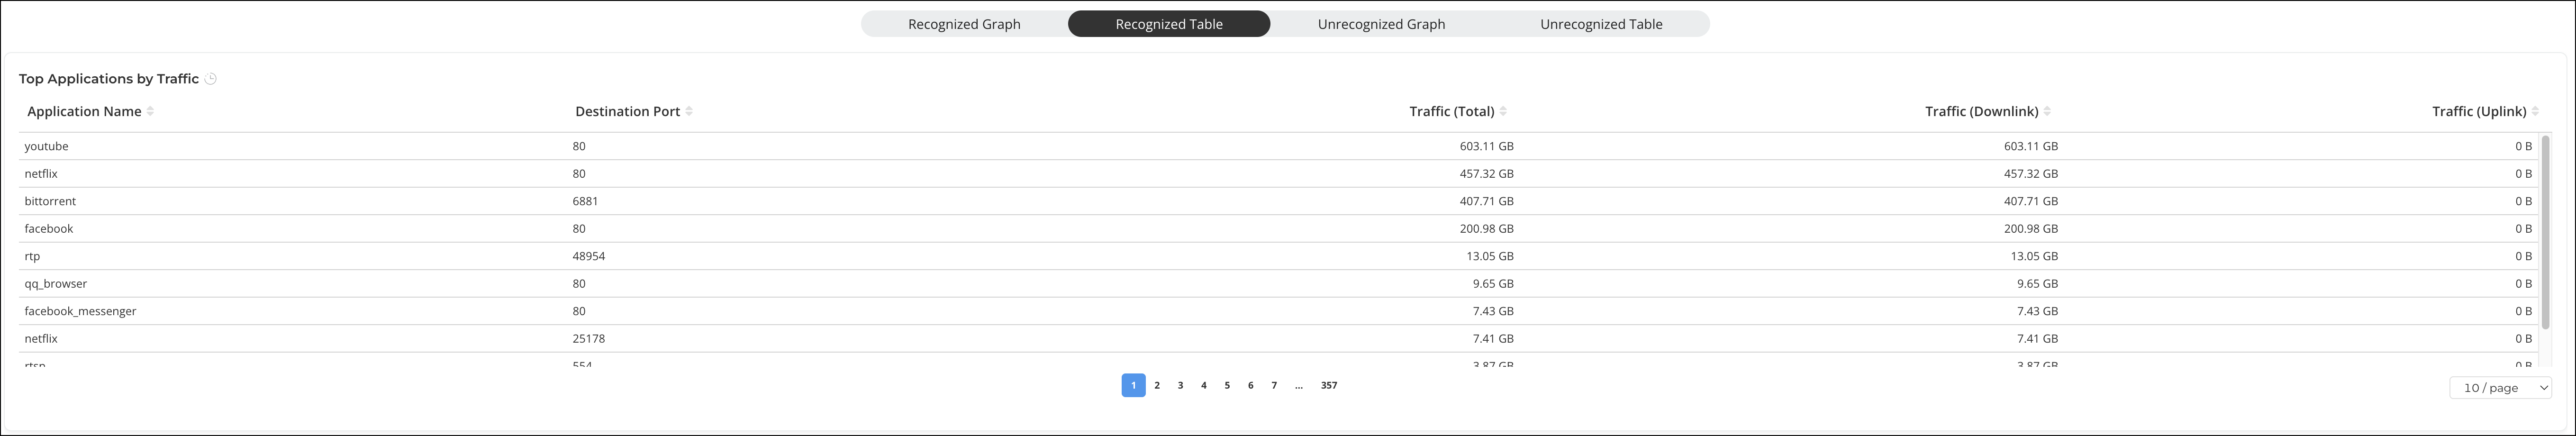
- Recognized Table: Displays statistics of traffic from recognized applications in a tabular form.
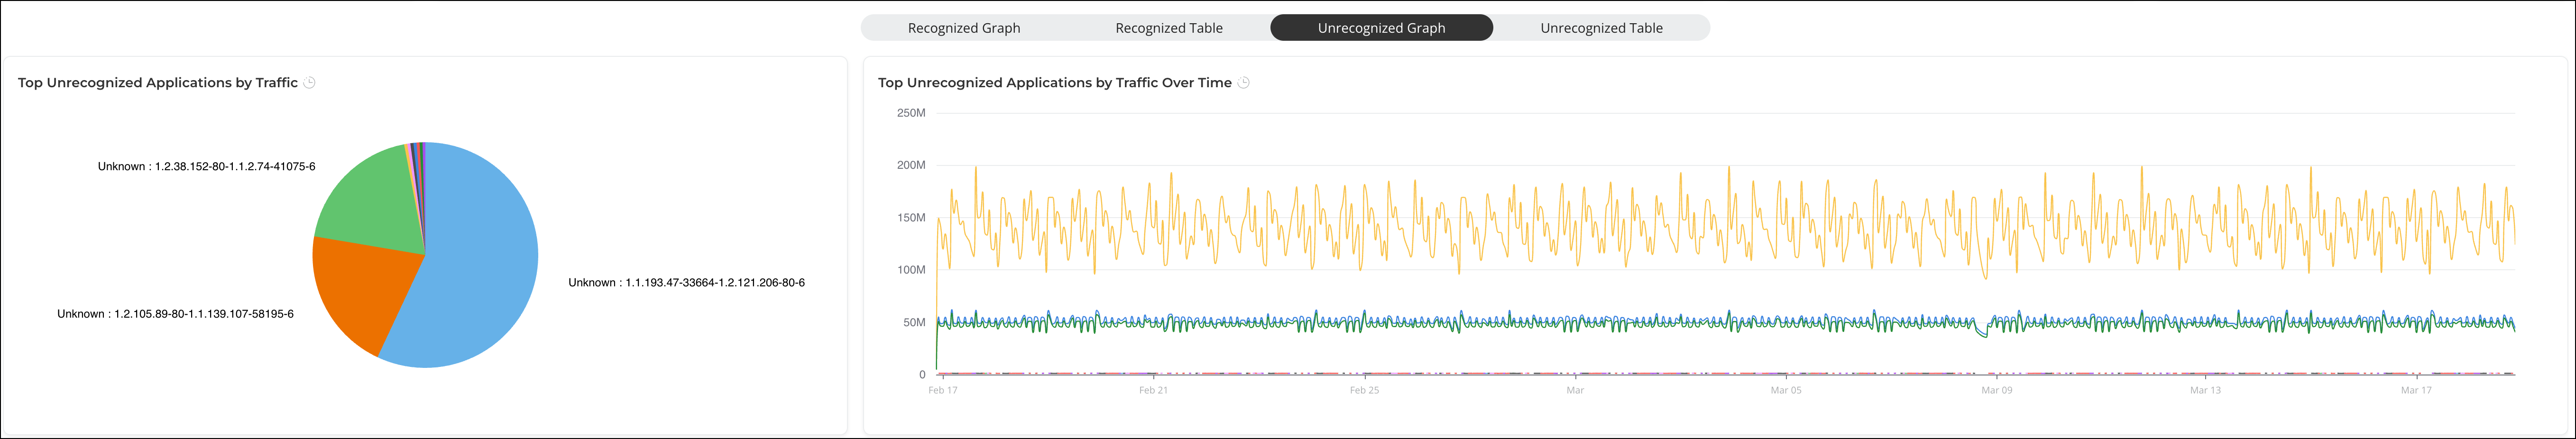
- Unrecognized Graph: Displays statistics of traffic from unrecognized applications in a graph.
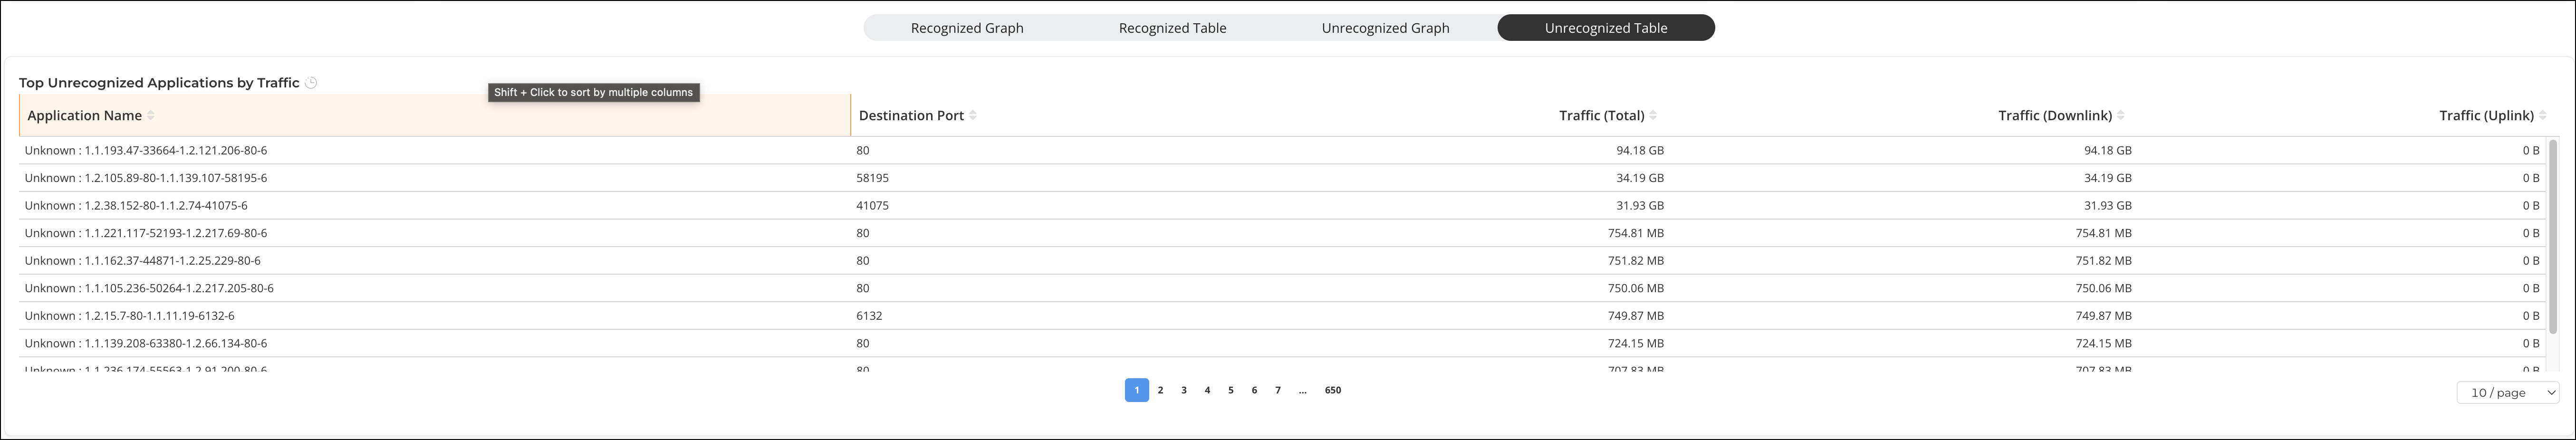
- Unrecognized Table: Displays statistics of traffic from unrecognized applications in a tabular form.
- The Top Applications by Traffic pane displays a pie chart. The pie chart displays the top 10 applications with the largest traffic volume in the network, along with the received and transmitted traffic for the selected time period in the Date and Time filter. Pausing your cursor over the chart displays an information box with the details of the selected application.
- The Top Applications by Traffic Over Time pane displays a graph. The graph displays the top 10 applications with the largest traffic in the network, along with the received and transmitted traffic over specific time intervals for the selected time period in the Date and Time filter. Pausing your cursor over the graph displays an information box with the details of the application at that time and date.
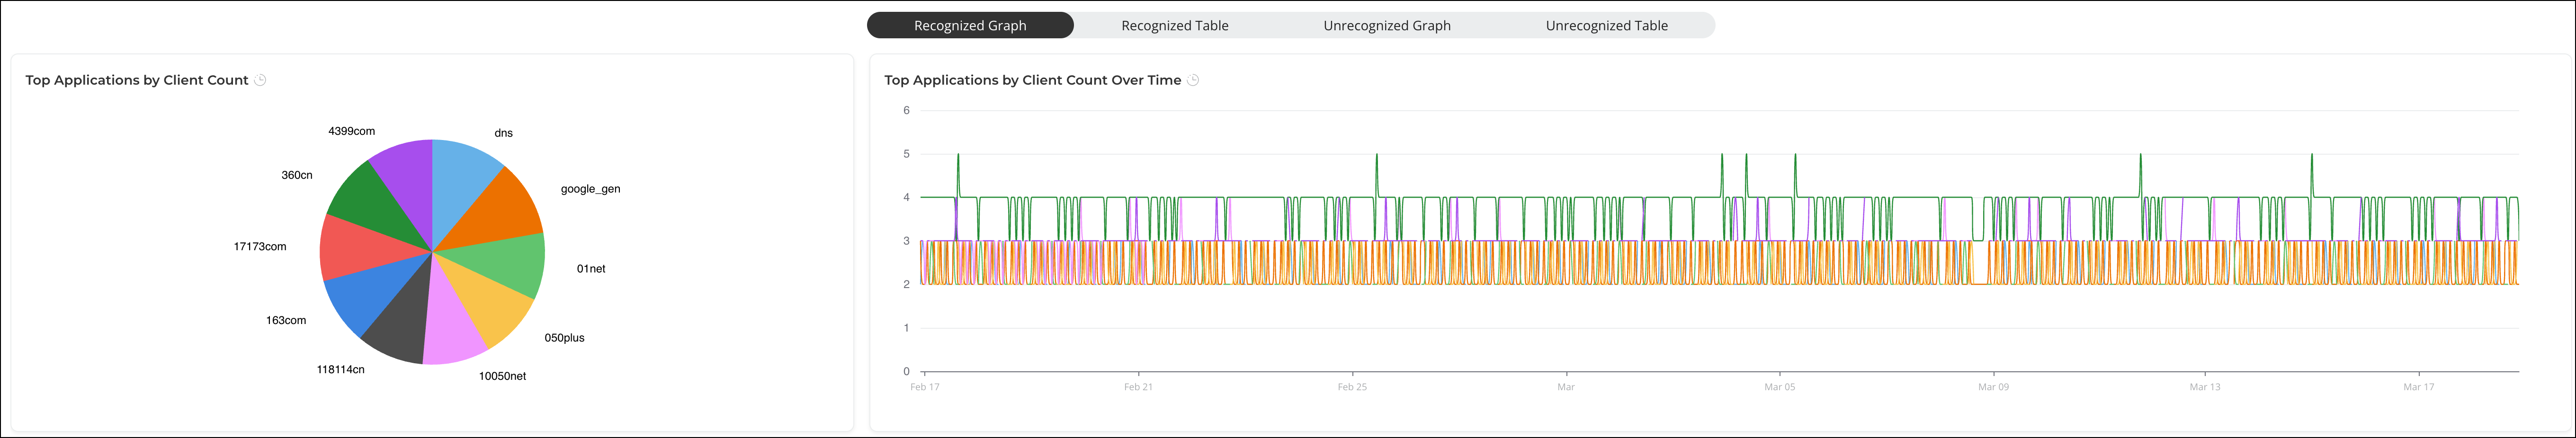
Top Applications by Client Count Tile
- Recognized Graph: Displays statistics of recognized applications by number of clients in a graph.
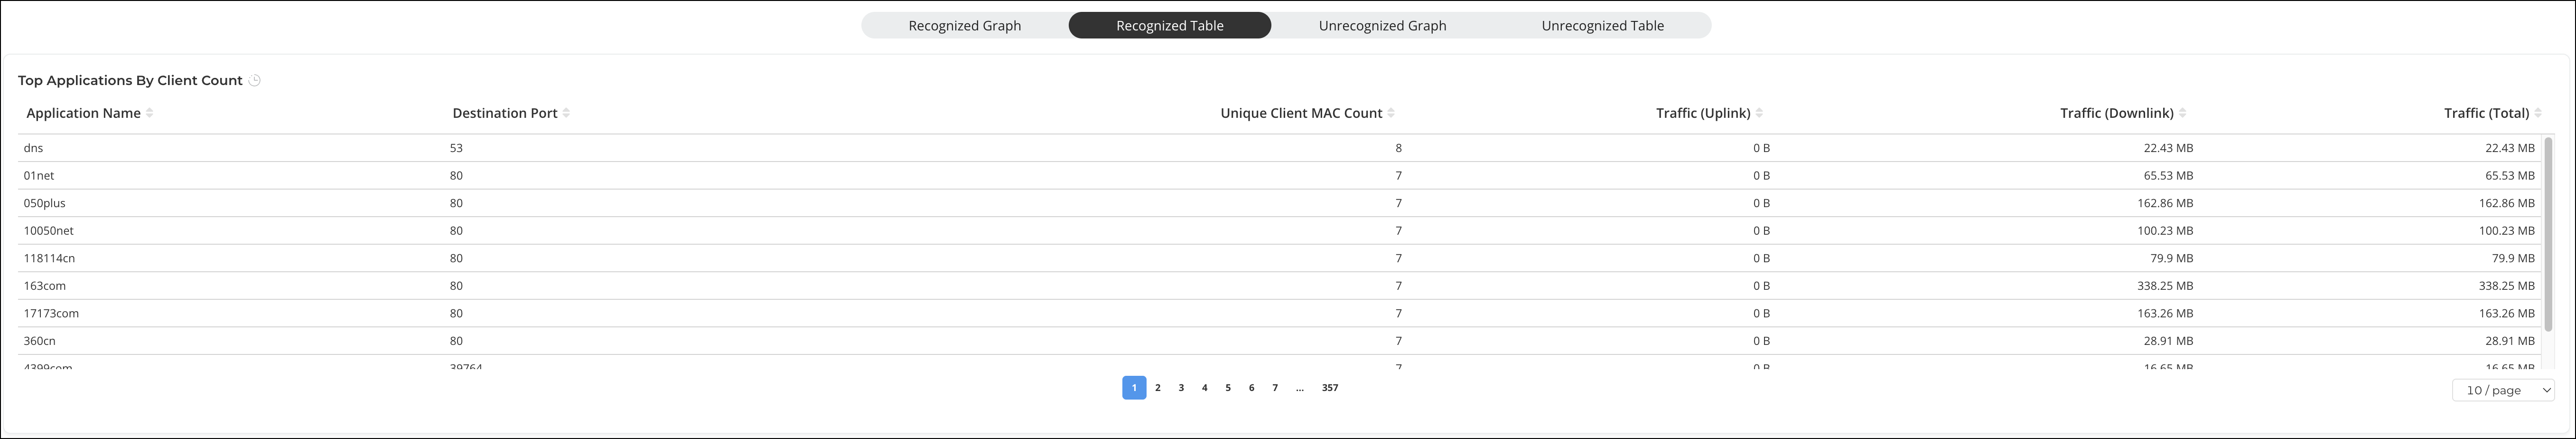
- Recognized Table: Displays statistics of recognized applications by number of clients in a tabular form.
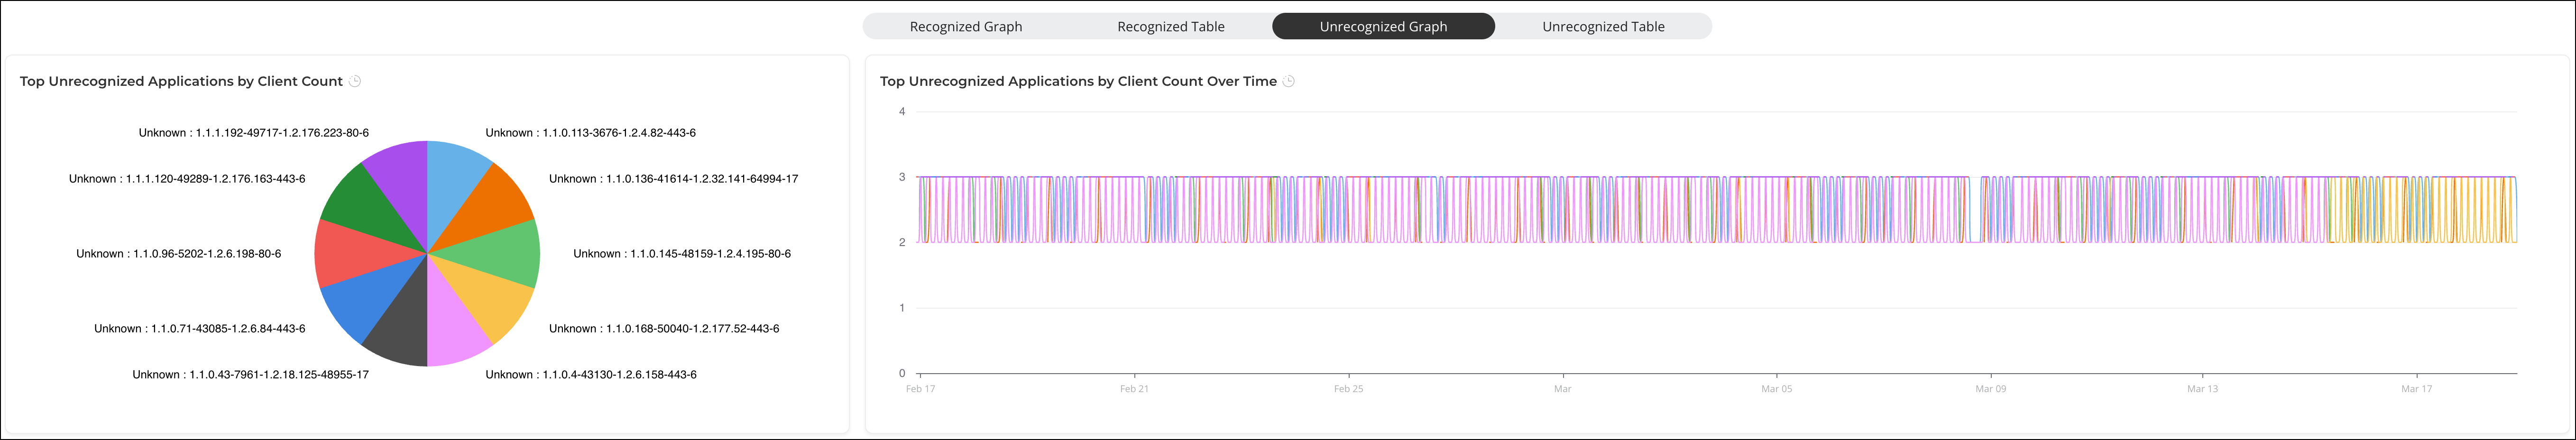
- Unrecognized Graph: Displays statistics of unrecognized applications by number of clients in a graph.
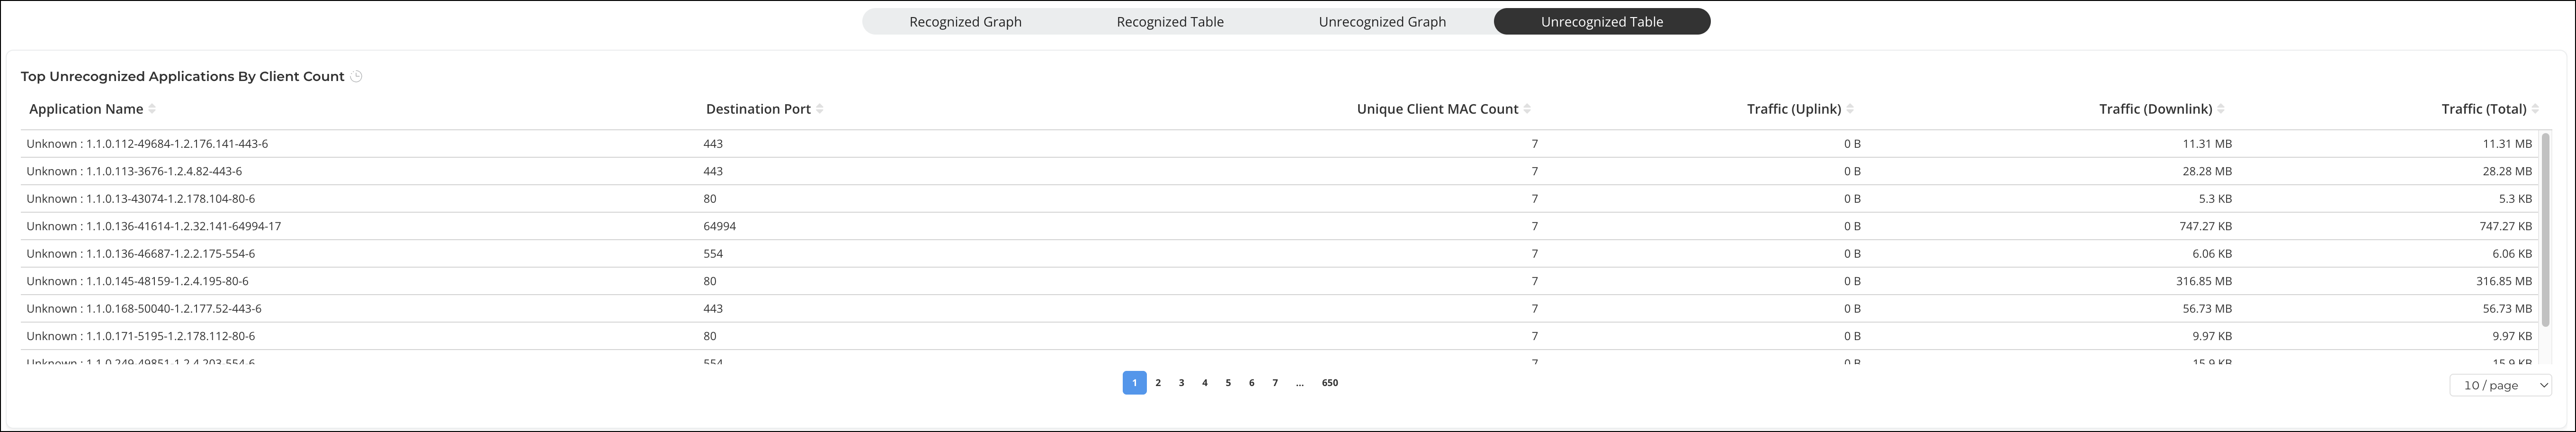
- Unrecognized Table: Displays statistics of unrecognized applications by number of clients in a tabular form.
-
The Top Applications by Client Count pane displays a pie chart. The pie chart displays the top 10 applications that are most frequently being used by the clients in the network for the selected time period in the Date and Time filter. Pausing your cursor over the chart displays an information box with the details of the selected application.
-
The Top Applications by Client Count Over Time pane displays a graph. The graph displays the top 10 applications that are most frequently being used by the clients in the network over specific time intervals for the selected time period in the Date and Time filter. Pausing your cursor over the graph displays an information box with the details of the selected application at that time and date.
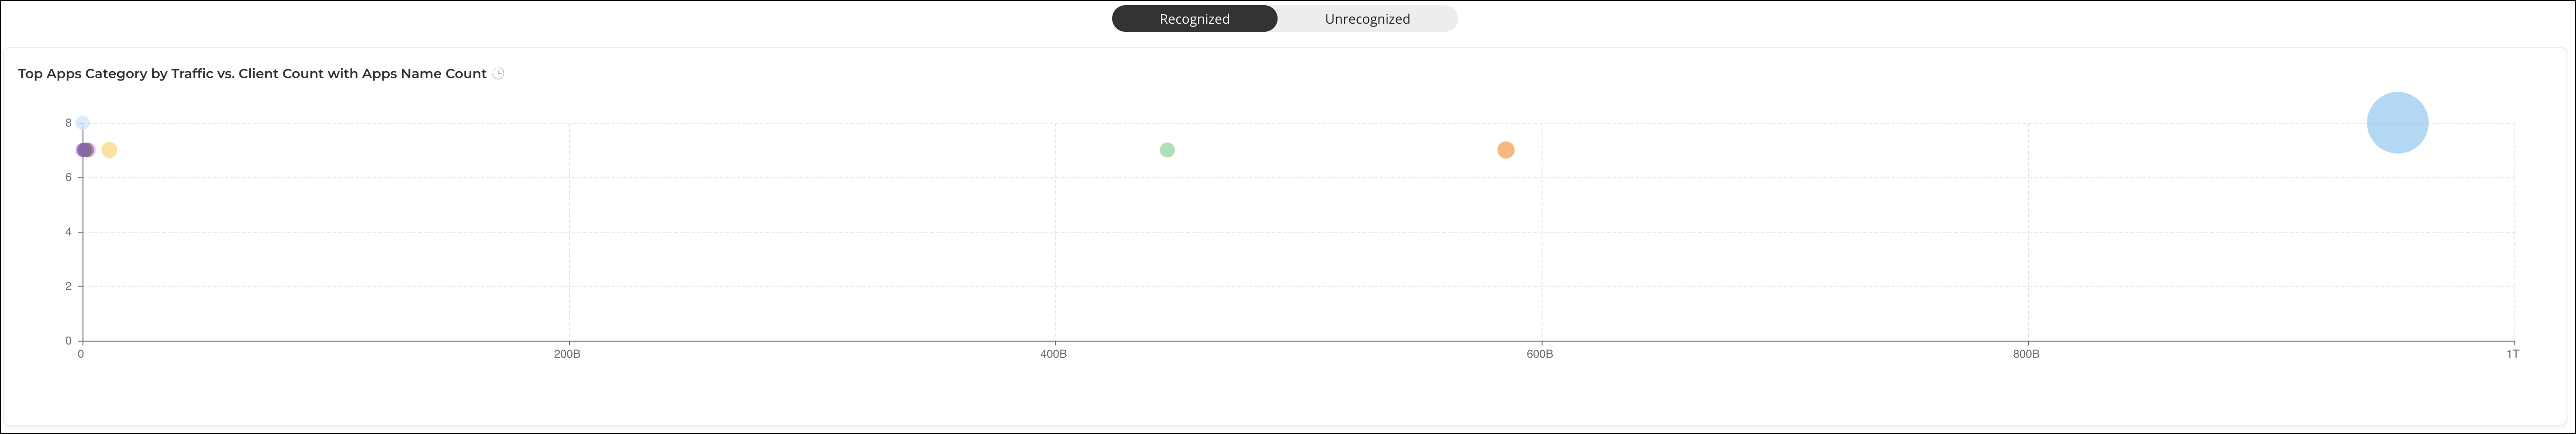
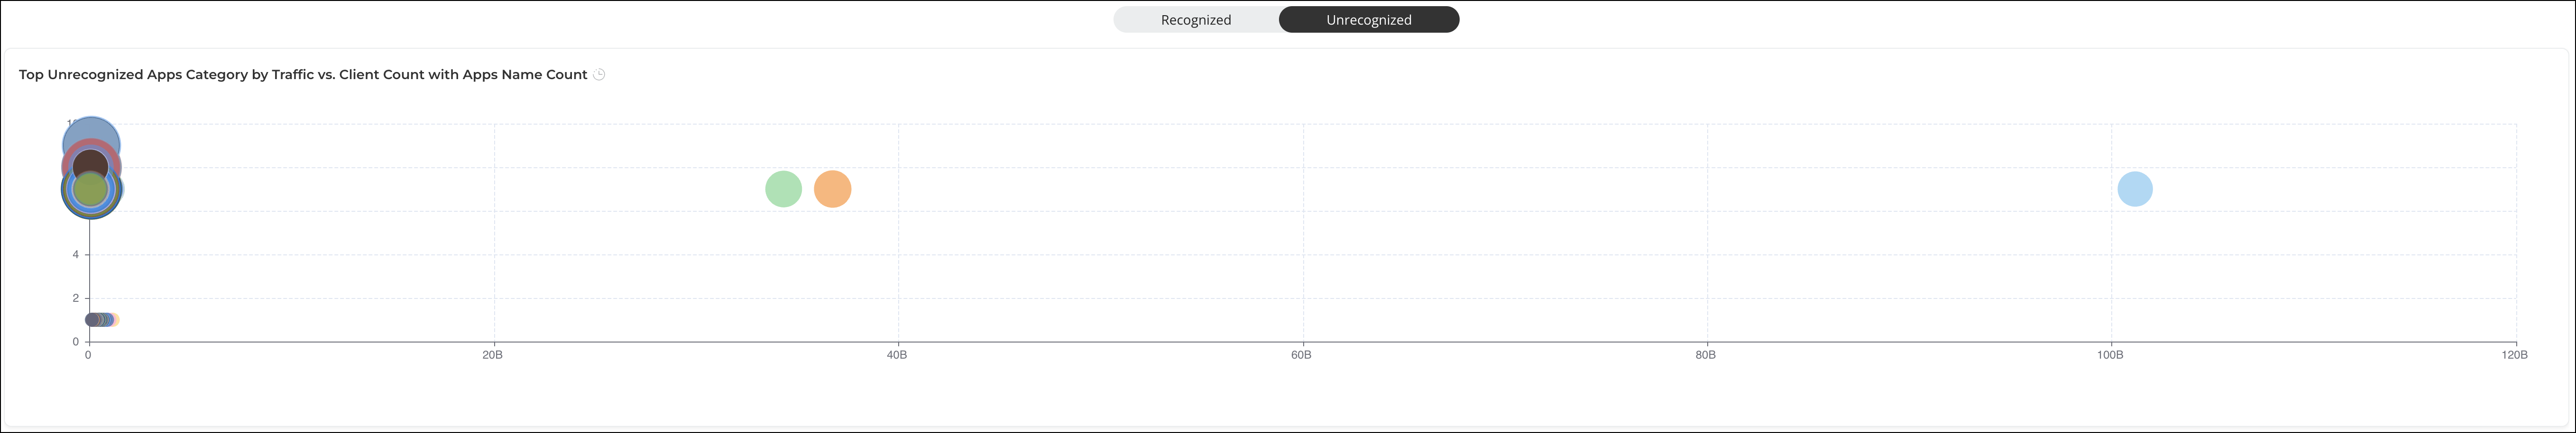
Top Apps Category by Traffic vs. Client Count with Apps Name Count Tile
The Top Apps Category by Traffic vs. Client Count with Apps Name Count tile facilitates analysis of the usage of various categories of applications within the network. The bubble chart displays the top 50 application categories based on total traffic and client count. Each bubble represents an application category, with the X-axis showing the total traffic generated and the Y-axis showing the number of unique clients using applications within that category. The size of each bubble is in direct proportion to the number of distinct applications used that fall within the specified application category. Larger bubbles indicate application categories having a larger number of distinct applications.
Pausing your cursor over each bubble displays detailed information, including the name of the application category, total traffic, unique client count, and the count of distinct applications. This visualization helps you to quickly identify which application categories are most extensively used.
- Recognized: Displays statistics of recognized application categories by traffic versus client count with application name count.
- Unrecognized: Displays statistics of unrecognized application categories by traffic versus client count with application name count.