Wired Report
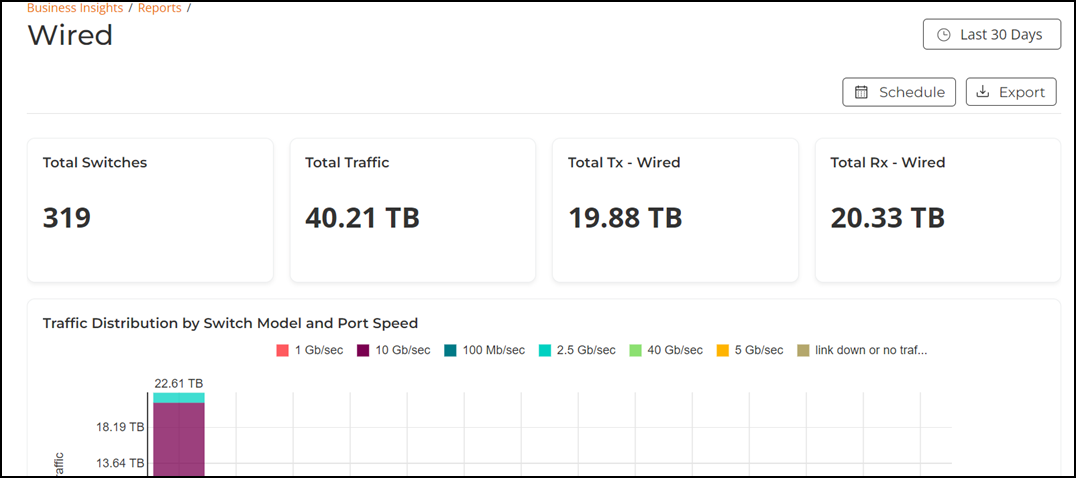
The Wired Report page provides details of total traffic, APs, and clients on the network. It also contains information regarding the received and transmitted traffic between them.
From the navigation bar, select . Alternative path, , click View on the Wired Report tile. The Wired Report page is displayed.
- Overview tile
- Traffic Distribution by Switch Model and Port Speed tile
- Top Switches by Traffic tile
- Top Switches by PoE Usage tile
- Top Switches by Errors tile
- Traffic Trend tile
- Error Trend tile
The data displayed on this page is based on the selected Date and Time filter and Network Hierarchy filter. Use the Date and Time filter in the upper-right corner to select a predefined time range or configure a custom date and time range. Use the Network Hierarchy filter to refine the displayed data by network scope.
The top right corner of the page also displays options to download reports in PDF and PNG formats. You can also share the report via e-mails on-demand or periodically by configuring a schedule (daily, weekly, or monthly).
Overview Tile
- Current Switch Status: Displays the total number of switches along with the number of switches currently online and offline based on the latest available Switch status information. The timestamp of the latest status update is also displayed.
- Switch Availability : Displays the total number of switches detected during the selected time range, including the number of switches that remained continuously online (Always Online) and switches that went offline at least once (Ever Offline) during the selected period.
- Total Traffic: Displays the total traffic processed by the switches during the selected time range.
- Tota Tx: Displays the total transmitted (outbound) traffic processed by the switches during the selected time range.
- Total Rx: Displays the total received (inbound) traffic processed by the switches during the selected time range.
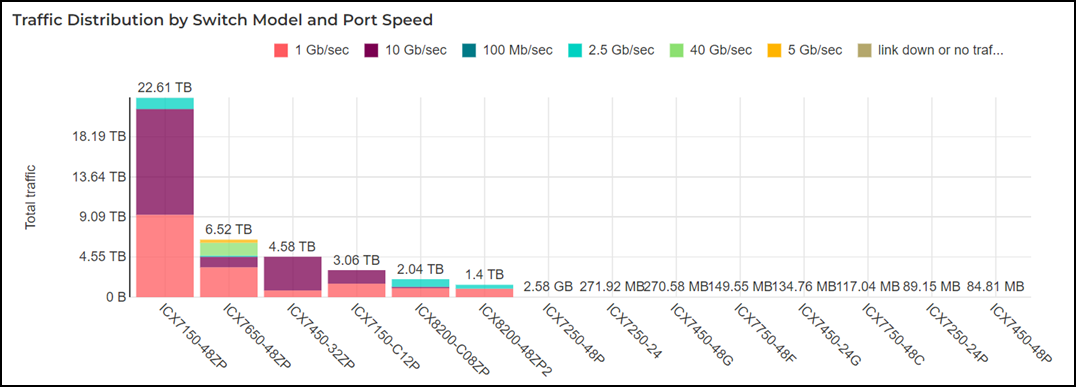
Traffic Distribution by Switch Model and Port Speed Tile
The Traffic Distribution by Switch Model and Port Speed tile contains a graph that displays the distribution of traffic by port speed for each switch model being used for the selected time period in the Date and Time filter. Pausing the pointer over the graph displays an information box with the switch details at that time and date. Click any of the colored squares to hide the selected port speed in the graph. The information icon box that is not filled with colour is hidden in the graph.
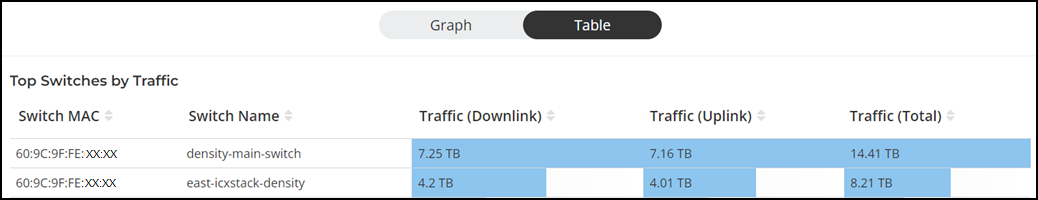
Top Switches by Traffic Tile
The Top Switches by Traffic tile contains two panes Top Switches by Traffic and Top Switches by Traffic Over Time.
The Top Switches by Traffic pane displays a donut chart. The donut chart display the top 10 wired switches have the most traffic in your network, along with the switch MAC address for the selected time period in the Date and Time filter. Pausing the pointer over the chart displays an information box with the details of the selected wired switch.
The Top Switches by Traffic Over Time pane displays a graph. The graph display the top 10 wired switches have the most traffic in your network, along with the switch MAC address for the selected time period in the Date and Time filter. Pausing the pointer over the graph displays an information box with the details of the selected wired switch at that time and date. Click any of the colored squares to hide the selected wired switch in the graph. The information icon that is hidden is displayed in gray.
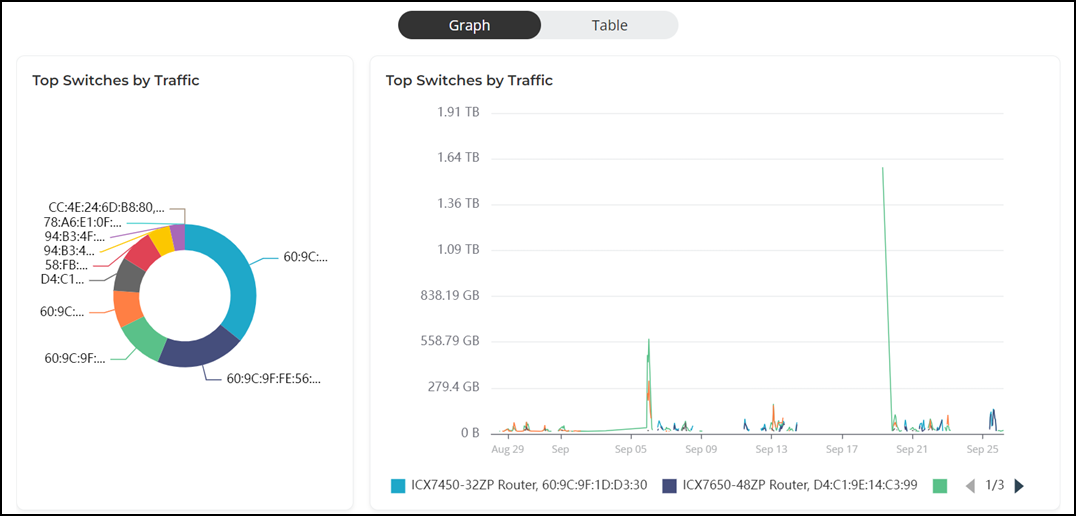
To view all the wired switches, click Table icon. The table is displayed with the switch MAC, switch name, downlink traffic, uplink traffic, and total traffic count information for the selected time period in the Date and Time filter. You can control the number of switches displayed in the tile by selecting All, 10 per tile, or 20 per tile options from the drop down at the bottom of the tile.
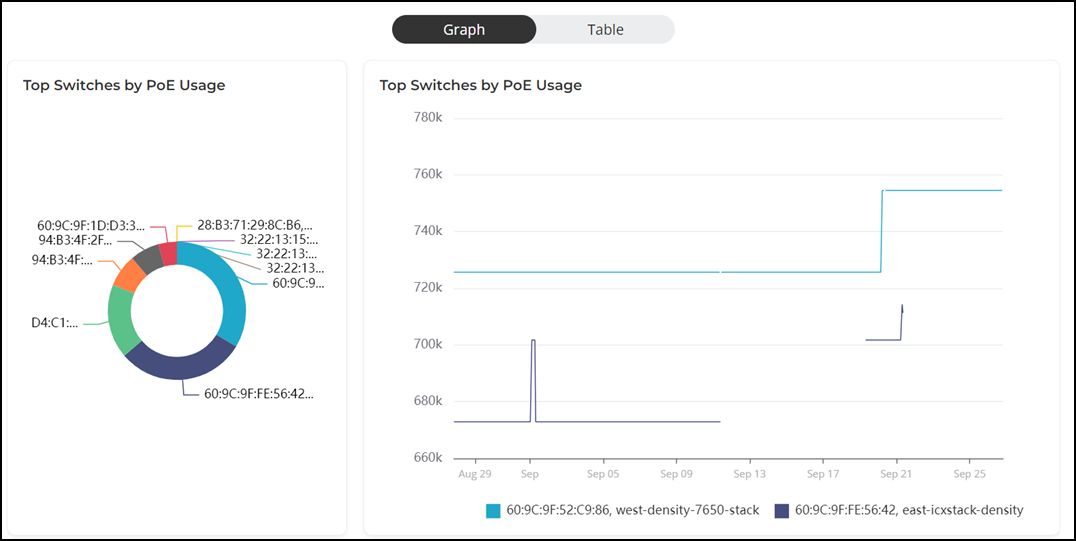
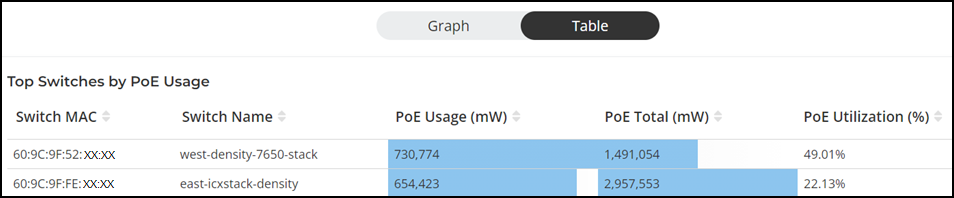
Top Switches by PoE Usage Tile
The Top Switches by PoE Usage tile contains two panes Top Switches by PoE Usage and Top Switches by PoE Usage Over Time.
The Top Switches by PoE Usage pane displays a donut chart. The donut chart display the top 10 wired switches utilizing the most power over the internet in your network, along with the switch MAC address for the selected time period in the Date and Time filter. Pausing the pointer over the chart displays an information box with the details of the selected wired switch.
The Top Switches by Traffic Over Time pane displays a graph. The graph display the top 10 wired switches utilizing the most power over the internet in your network, along with the switch MAC address for the selected time period in the Date and Time filter. Pausing the pointer over the graph displays an information box with the details of the selected wired switch at that time and date. Click any of the colored squares to hide the selected wired switch in the graph. The information icon that is hidden is displayed in gray.
To view all the wired switches, click Table icon. The table is displayed with the switch MAC, switch name, PoE usage in milliwatts, PoE total in milliwatts, and PoE utilization percentage information for the selected time period in the Date and Time filter. In the table, you can select the number of switches displayed in the tile from the drop down at the bottom of the tile. The range is from 10 switches per tile to 200 switches per tile.
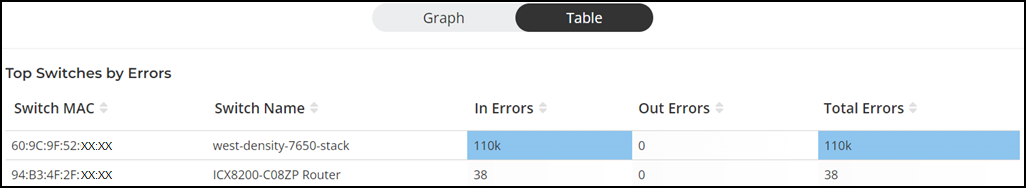
Top Switches by Errors Tile
The Top Switches by Errors tile contains two panes Top Switches by Errors and Top Switches by Errors Over Time.
The Top Switches by Errors pane displays a donut chart. The donut chart displays the error count for switches in your network for the selected time period in the Date and Time filter. Pausing the pointer over the chart displays an information box with the details of the selected switch.
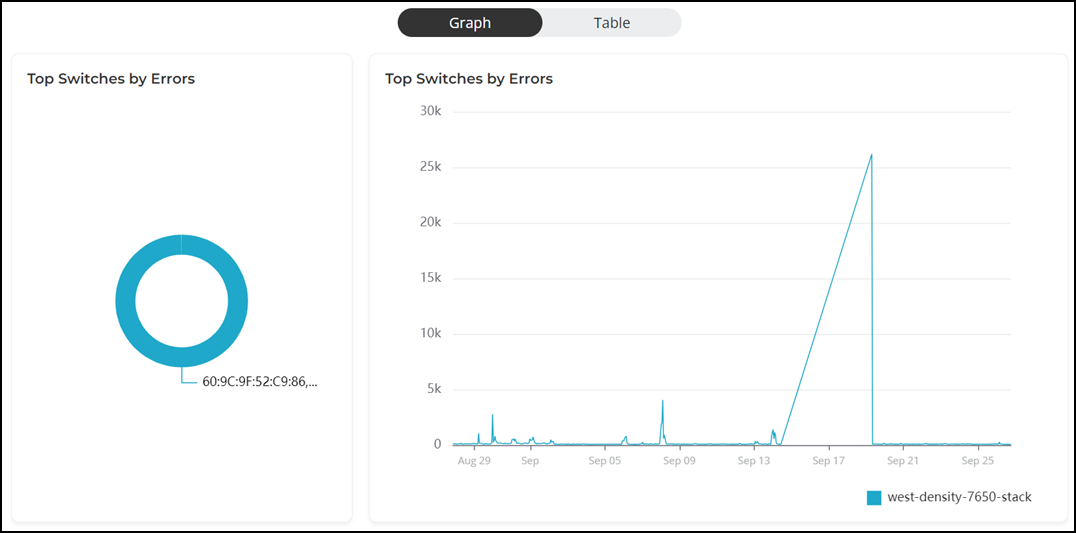
To view all the switches, click Table icon. The table is displayed with the switch MAC, switch name, in errors, out errors, and total errors for the selected time period in the Date and Time filter. You can control the number of AP models displayed in the tile by selecting All, 10 per tile, or 20 per tile options from the drop down at the bottom of the tile.
Traffic Trend Tile
The Traffic Trend tile contains a graph that displays the traffic information about the wired switches in the network for the selected time period in the Date and Time filter. Pausing the pointer over the graph displays an information box with the wired switches traffic details at that time and date. Click any of the colored squares to hide the selected switch traffic details in the graph. The information icon that is hidden is displayed in gray.
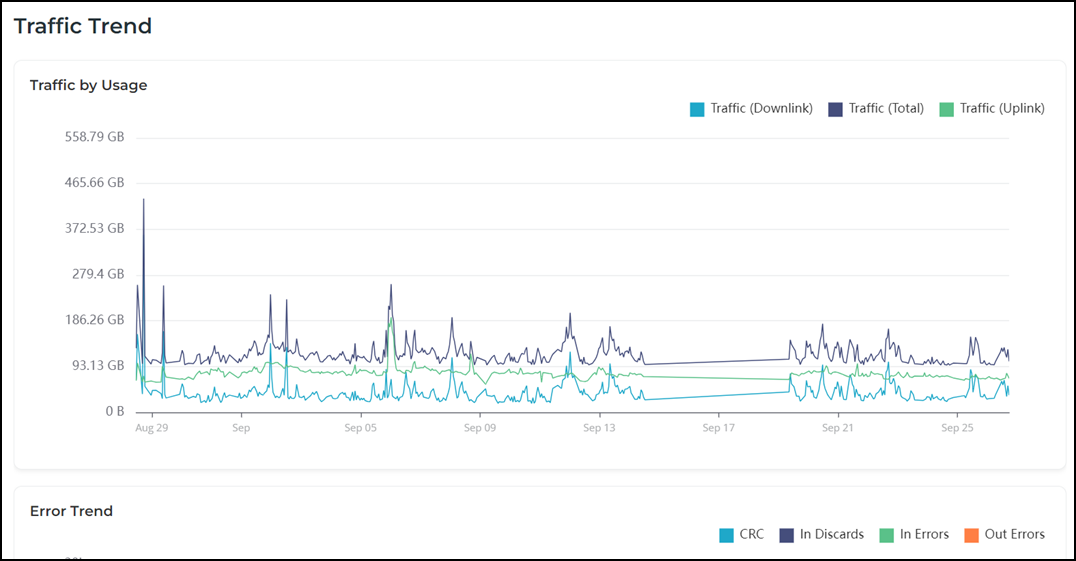
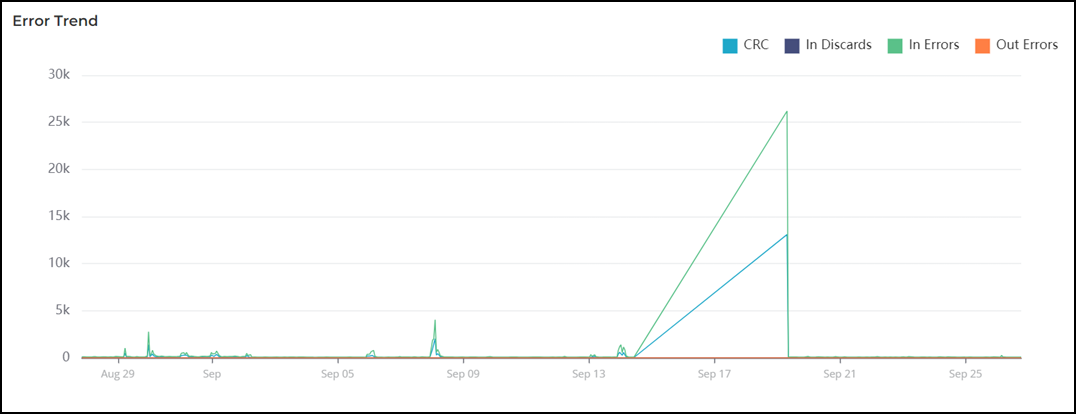
Error Trend Tile
The Error Trend tile contains a graph that displays the error count trend over time such as in Errors, out Errors, CRC, and in discards for the selected time period in the Date and Time filter. Pausing the pointer over the graph displays an information box with error trend details at that time and date. Click any of the colored squares to hide the selected error in the graph. The information icon that is hidden is displayed in gray.