Switches Report
The Switches Report page provides details on switch inventory, including switch models and software versions that are being used the most.
- On the navigation bar, select . The Reports page is displayed.
- Click View on the Access Points tile. The Switches Report page is displayed.
- Overview tile
- Switch Count Trend tile
- Switch Unit Count Trend tile
- Switch Status Trend tile
- Port Status Trend tile
- Top Switch Software Versions tile
- Top Switch Models tile
The data displayed on this page is based on the selected Date and Time filter and Network Hierarchy filter. Use the Date and Time filter in the upper-right corner to select a predefined time range or configure a custom date and time range. Use the Network Hierarchy filter to refine the displayed data by network scope.
The top right corner of the page also displays options to download reports in PDF and PNG formats. You can also share the report via e-mails on-demand or periodically by configuring a schedule (daily, weekly, or monthly).
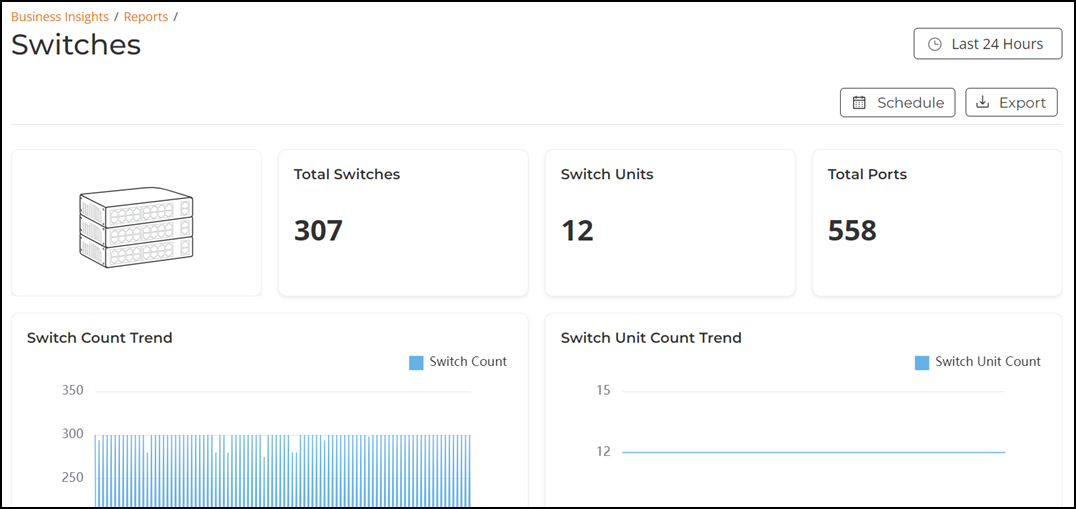
Overview Tile
The Overview tile provides a general overview of the switches on the network and displays the count of total switches, switch units, and total ports for the selected time period in the Date and Time filter.
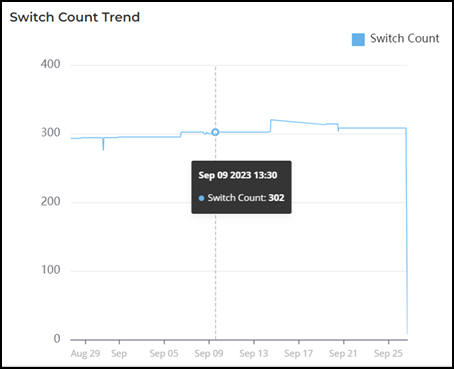
Switch Count Trend Tile
The Switch Count Trend tile contains a graph that displays the switch count trend for the selected time period in the Date and Time filter. Pausing the pointer over the graph displays an information box with the switch details at that time and date.
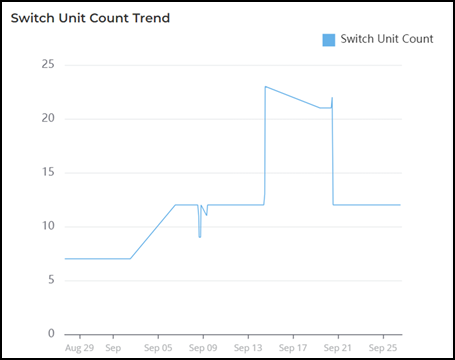
Switch Unit Count Trend Tile
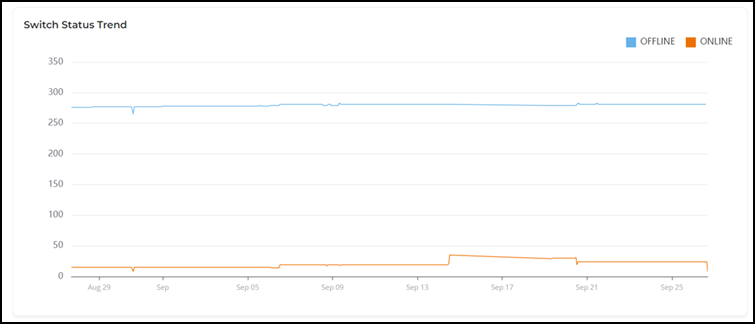
Switch Status Trend Tile
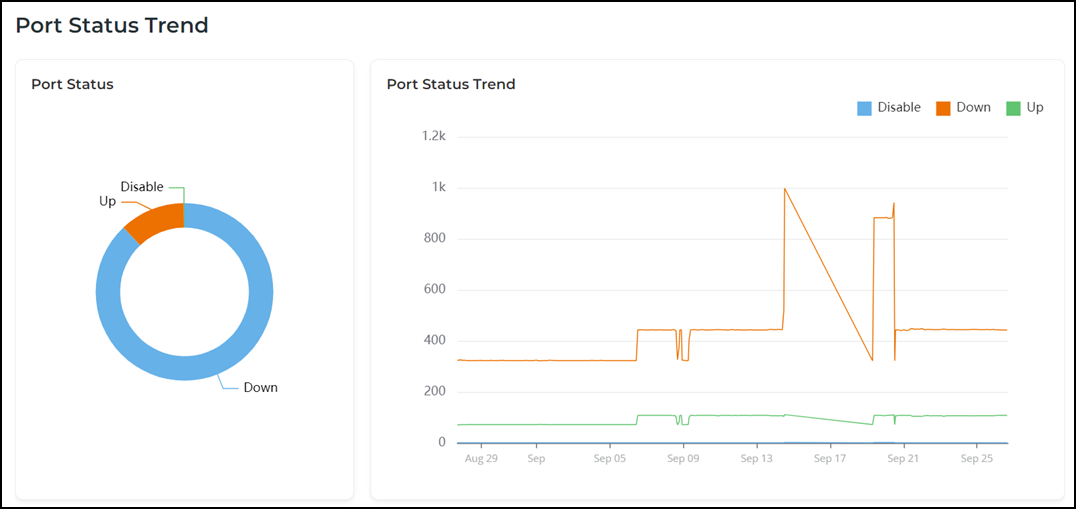
Port Status Trends Tile
The Port Status Trends tile contains two panes Port Status and Port Status Trend.
The Port Status pane displays a donut chart. The donut chart display the the status of the ports as up, down, and disable for the selected time period in the Date and Time filter. Pausing the pointer over the chart displays an information box with the details of the selected status.
The Port Status Trend pane displays a graph. The graph display the status of the ports as up, down, and disable for the selected time period in the Date and Time filter. Pausing the pointer over the graph displays an information box with the status details at that time and date. You can hide any of this information displayed in the graph by clicking the Disable, Down, or Up icon at the top of the graph. The information icon that is hidden is displayed in gray.
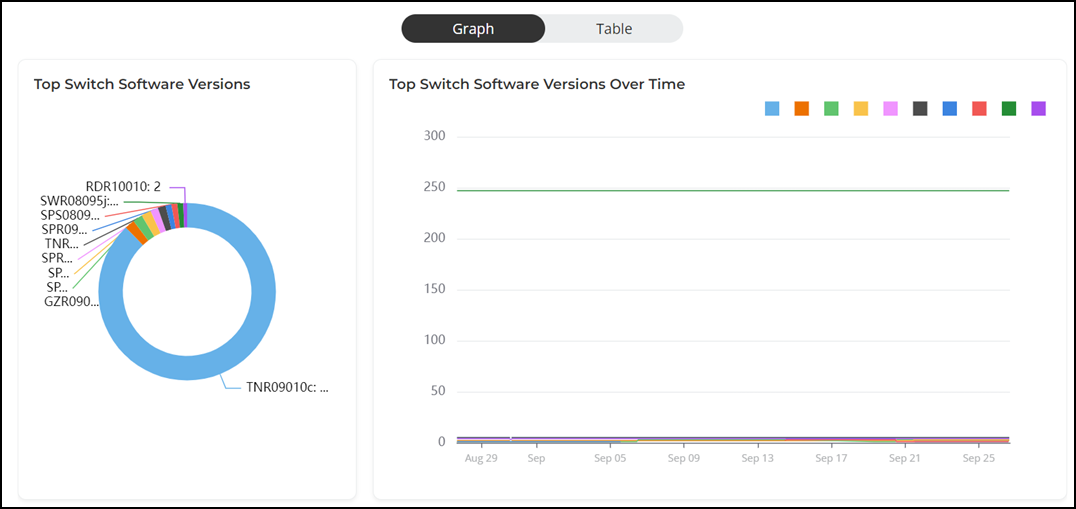
Top Switch Software Versions Tile
The Top Switch Software Versions tile contains two panes Top Switch Software Versions and Top Switch Software Versions Over Time.
The Top Switch Software Versions pane displays a donut chart. The donut chart display the top 10 most-used switch software versions in your network, along with the count of switches using each software versions for the selected time period in the Date and Time filter. Pausing the pointer over the chart displays an information box with the details of the selected software versions.
The Top Switch Software Versions Over Time pane displays a graph. The graph display the top 10 most-used switch software versions in your network, along with the count of switches using each software versions for the selected time period in the Date and Time filter. Pausing the pointer over the graph displays an information box with the details of the selected switch software versions along with the count of switch using each software versions at that time and date. Click any of the colored squares to hide the selected software versions in the graph. The information icon that is hidden is displayed in gray.
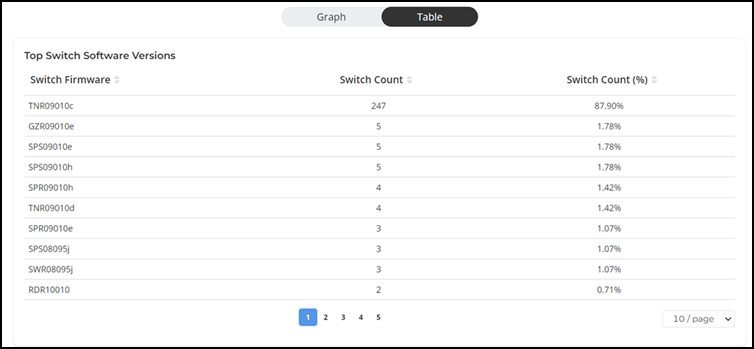
To view all the switch software versions, click Table icon. The table is displayed with the switch firmware, count, and count percentage information for the selected time period in the Date and Time filter. You can control the number of switch software versions displayed in the tile by selecting All, 10 per tile, or 20 per tile options from the drop down at the bottom of the tile.
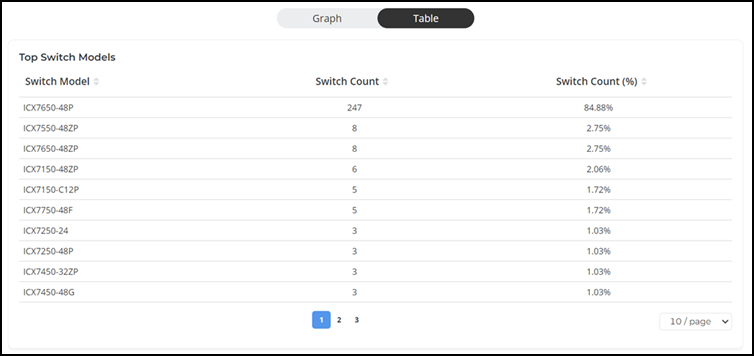
Top Switch Models Tile
The Top Switch Models tile contains two panes Top Switch Models and Top Switch Models Over Time.
The Top Switch Models pane displays a donut chart. The donut chart display the top 10 switch model type that is most often used in your network for the selected time period in the Date and Time filter. Pausing the pointer over the chart displays an information box with the details of the selected switch model.
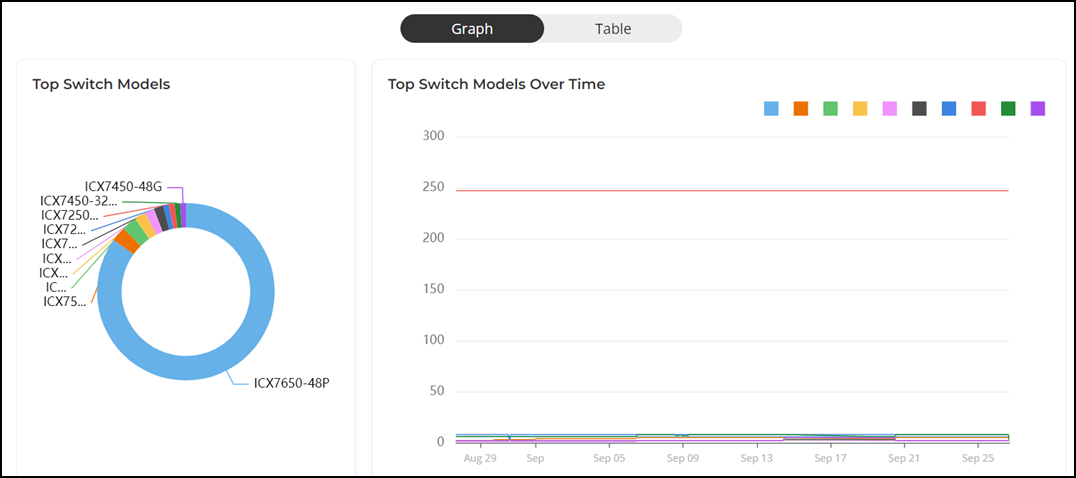
To view all the switch models, click Table icon. The table is displayed with the switch model, count, and count percentage information for the selected time period in the Date and Time filter. You can control the number of switch models displayed in the tile by selecting All, 10 per tile, or 20 per tile options from the drop down at the bottom of the tile.