Applications Report
The Applications Report contains the predefined applications that are accessed by the users.
From the navigation bar, select . Alternate path, , click View on the Applications Report tile. The Applications Report page is displayed.
The Applications Report page contains the details of the applications accessed by the user and predefined by RUCKUS AI. The overview contains the list of recognized applications. The rest of the report contains the top ten applications by traffic volume received and transmitted over time, client count, traffic, and clients.
- Overview tile
- Top Applications by Traffic tile
- Top Applications by Client Count tile
- Top Apps by Traffic vs. Client Count with AP Count tile
The data displayed on this page is based on the selected Date and Time filter and Network Hierarchy filter. Use the Date and Time filter in the upper-right corner to select a predefined time range or configure a custom date and time range. Use the Network Hierarchy filter to refine the displayed data by network scope.
The top right corner of the page also displays options to download reports in PDF and PNG formats. You can also share the report via e-mails on-demand or periodically by configuring a schedule (daily, weekly, or monthly).
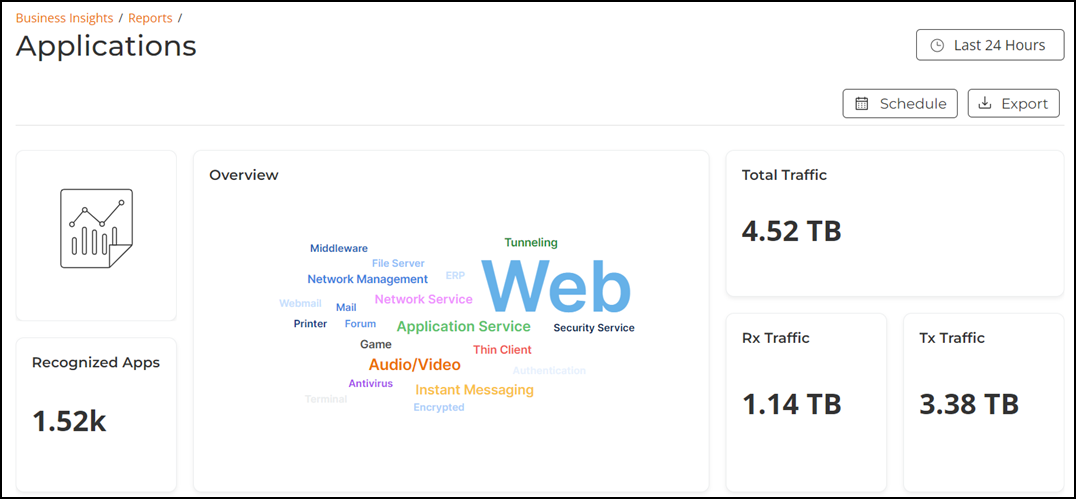
Overview Tile
The Overview tile provides an overview of all applications recognized by the application-recognition engine and the traffic volumes that these applications consume for the selected time period in the Date and Time filter.
The Overview tile displays the following information:
- The number of recognized applications
- Overview word cloud chart
- Total traffic
- Total inbound (Rx) traffic
- Total outbound (Tx) traffic
Top Applications by Traffic Tile
The Top Applications by Traffic tile contains two panes Top Applications by Traffic and Top Applications by Traffic Over Time.
The Top Applications by Traffic pane displays a donut chart. The donut chart display the top 10 applications with the largest traffic in the network, along with the received and transmitted traffic for the selected time period in the Date and Time filter. Pausing the pointer over the chart displays an information box with the details of the selected application.
The Top Applications by Traffic Over Time pane displays a graph. The graph display the top 10 applications with the largest traffic in the network, along with the received and transmitted traffic for the selected time period in the Date and Time filter. Pausing the pointer over the graph displays an information box with the details of the application at that time and date. Click any of the colored squares to hide the selected application in the graph. The information icon that is hidden is displayed in gray.
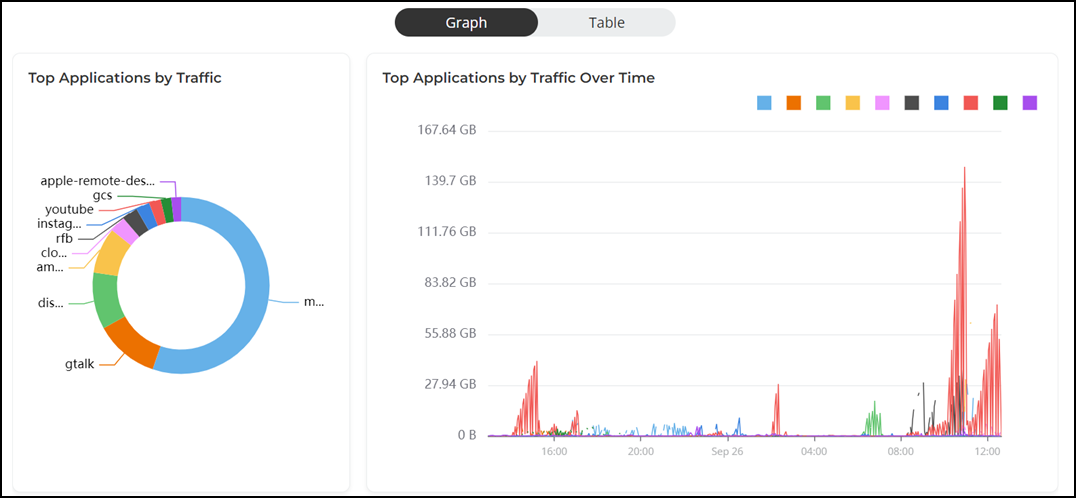
To view all the applications, click Table icon. The table is displayed with the application name, port, downlink traffic, uplink traffic, and total traffic for the selected time period in the Date and Time filter. In the table, you can select the number of applications displayed in the tile from the drop down at the bottom of the tile. The range is from 10 applications per tile to 200 applications per tile.

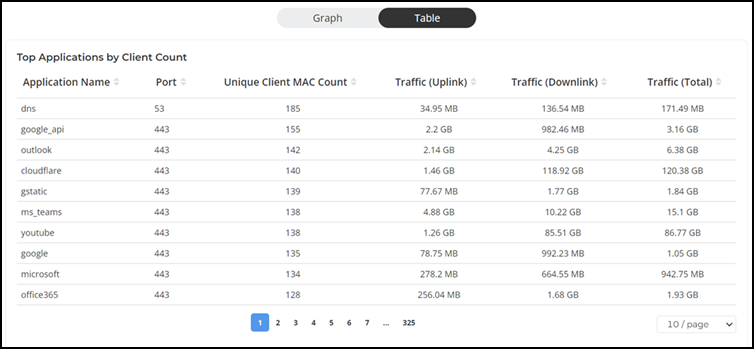
Top Applications by Client Count Tile
The Top Applications by Client Count tile contains two panes Top Applications by Client Count and Top Applications by Client Count Over Time.
The Top Applications by Client Count pane displays a donut chart. The donut chart display the top 10 applications that are most frequently being used by the clients in the network over specified time intervals for the selected time period in the Date and Time filter. Pausing the pointer over the chart displays an information box with the details of the selected application.
The Top Applications by Client Count Over Time pane displays a graph. The graph display the top 10 applications that are most frequently being used by the clients in the network over specified time intervals for the selected time period in the Date and Time filter. Pausing the pointer over the graph displays an information box with the details of the selected application at that time and date. Click any of the colored squares to hide the selected application in the graph. The information icon that is hidden is displayed in gray.
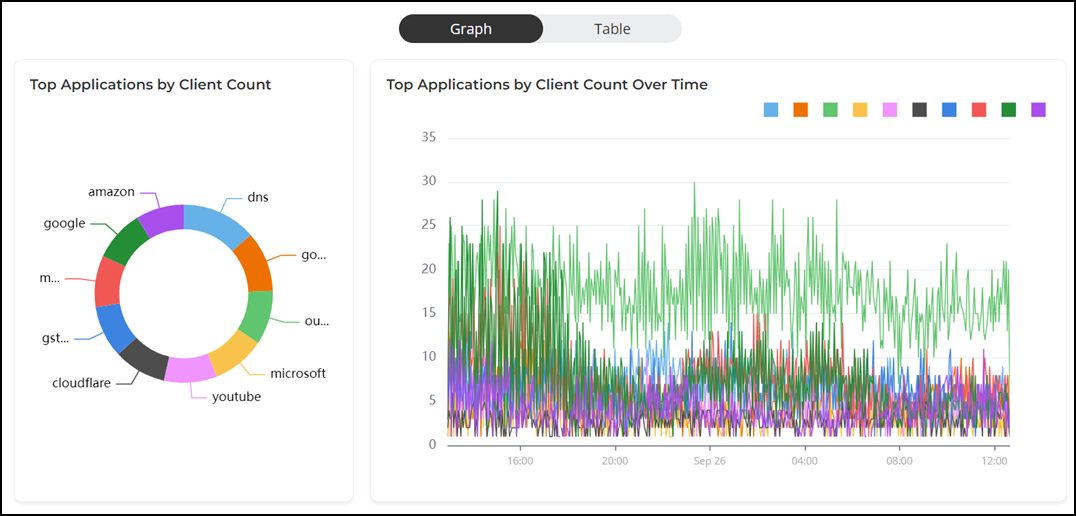
To view all the applications, click Table icon. The table is displayed with the application name, port, unique client MAC count, uplink traffic, downlink traffic, and total traffic for the selected time period in the Date and Time filter. In the table, you can select the number of applications displayed in the tile from the drop down at the bottom of the tile. The range is from 10 APs per tile to 200 APs per tile.
Use the graph and table icons to toggle between the chart and table views.
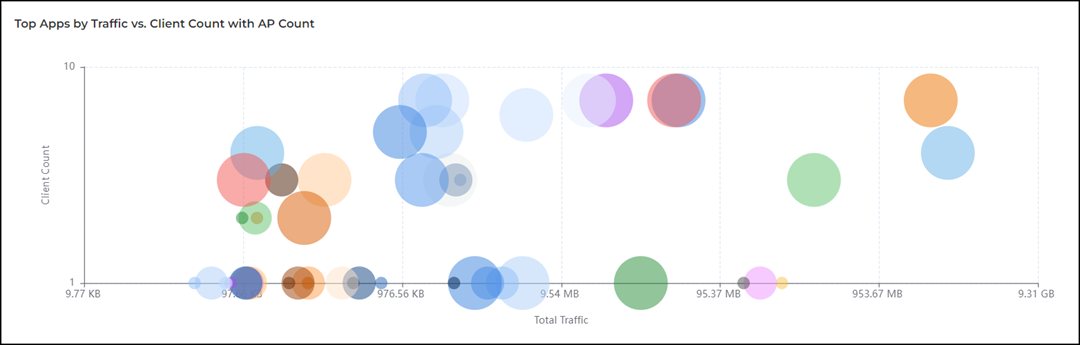
Top Apps by Traffic vs. Client Count with AP Count Tile
The Top Apps by Traffic vs. Client Count with AP Count tile facilitates the analysis of the usage of various applications within the network. The bubble chart displays the top 50 applications based on total traffic and client count. Each bubble represents an application, with the X-axis showing the total traffic generated and the Y-axis showing the number of unique clients using it. The size of each bubble indicates the number of access points through which the application is accessed. Larger bubbles indicate applications that are accessed through more access points, showing a wider spread of usage across the network