Energy Saving Report
The Energy Saving report provides details of energy consumption and savings across all venues, including the number of venues with Energy Saving enabled, total power consumption, and projected monthly power savings. The report also includes venue-level details such as AP count, Energy Saving status, engaged APs, consumption, and savings metrics.
These insights help you assess how effectively Energy Saving is utilized across different venues, identify areas with higher or lower efficiency, and understand the impact of the feature on overall energy usage.
Complete the following steps to view the
Energy Saving report.
- On the navigation bar, select . The Reports page is displayed.
- Click View on the Energy Saving tile. The Energy Saving page is displayed.
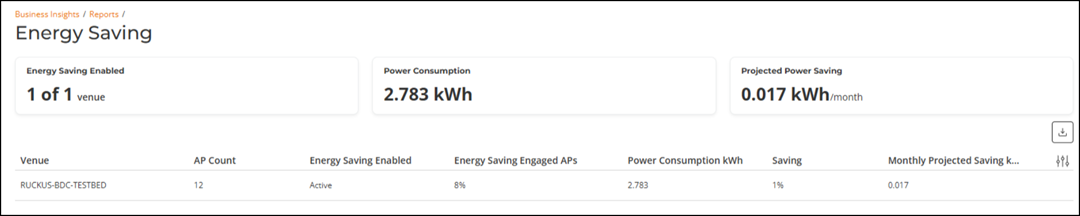
The overview panel includes the following metrics:
- Energy Saving Enabled: Displays the number of venues where Energy Saving is currently enabled out of the total number of venues.
- Power Consumption: Displays the total power consumed by APs.
- Projected Power Saving: Indicates the estimated amount of power that can be saved per month based on current Energy Saving activity.
The table includes the following columns:
- Venue: Displays the name of the venue for which Energy Saving data is reported.
- AP Count: Displays the the number of access points in the venue.
- Energy Saving Enabled: Displays the Energy Saving status for the venue.
- Energy Saving Engaged APs: Displays the the percentage of APs in the venue that have actively engaged Energy Saving.
- Power Consumption kWh: Displays the total power consumed by the APs in the venue.
- Saving: Displays the percentage of power saved in the venue as a result of Energy Saving.
- Monthly Projected Saving kWh: Displays the estimated monthly power saving (in kilowatt-hours) based on current Energy Saving activity in the venue.
The top right corner of the Energy Saving page displays options to the export reports in CSV format.