Access Points Report
The Access Points Report page provides detailed information about the APs connected to the network.
- On the navigation bar, select . The Reports page is displayed.
- Click View on the Access Points tile. The Access Points Report page is displayed.
- Overview tile
- Top APs By Offline Duration tile
- AP Count Trend tile
- AP Status tile
- AP Status Trend tile
- Top AP Models tile
- Top AP Software Versions tile
- Top AP Reboot Reasons tile
- Top AP Reboot Reasons Over Time tile
- Top APs by Reboot Count tile
- Top AP Alarm Types tile
- Top AP Alarm Types Over Time tile
- AP Details for Online/Offline Status table
Some of the tiles have the option to view the report in graphs and tables. The Graph and Table tabs are displayed on top of the applicable tiles. By default, in those tiles, the reports are displayed in graphical format. If you want to view the report in table format, click the Table tab.
The data displayed on this page is based on the selected Date and Time filter and Network Hierarchy filter. Use the Date and Time filter in the upper-right corner to select a predefined time range or configure a custom date and time range. Use the Network Hierarchy filter to refine the displayed data by network scope. For more information, refer to Content Panel.
The top right corner of the page also displays options to download reports in PDF and PNG formats. You can also share the report via e-mails on-demand or periodically by configuring a schedule (daily, weekly, or monthly). For more information on how to create a schedule, refer to Content Panel.
Overview Tile
- Current AP Status: Displays the total number of APs along with the number of APs currently online and offline based on the latest available AP status information. The timestamp of the latest status update is also displayed.
- AP Availability: Displays the total number of APs detected during the selected time range, including the number of APs that remained continuously online (Always Online) and APs that went offline at least once (Ever Offline) during the selected period.
- Total Reboots: Displays the total number of AP reboot events detected during the selected time range.
- APs with Alarms: Displays the number of APs that generated alarms during the selected time range.
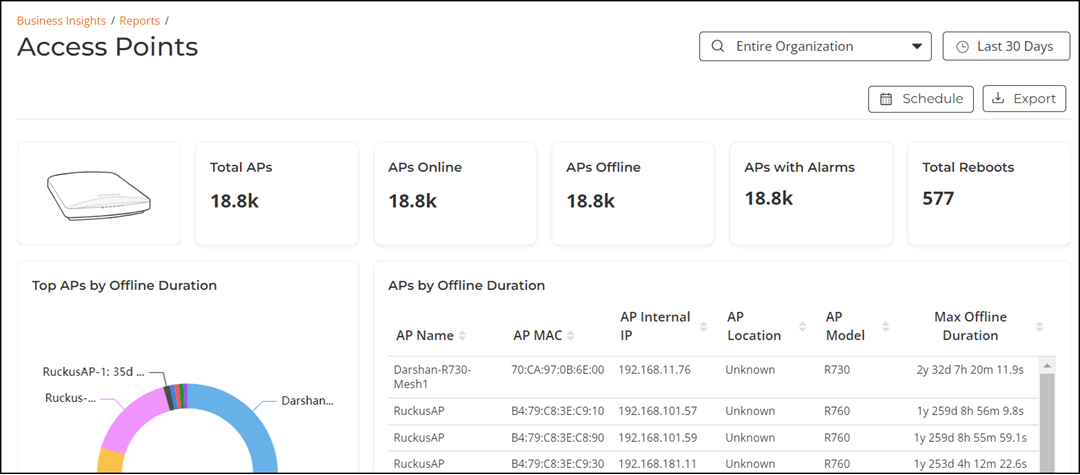
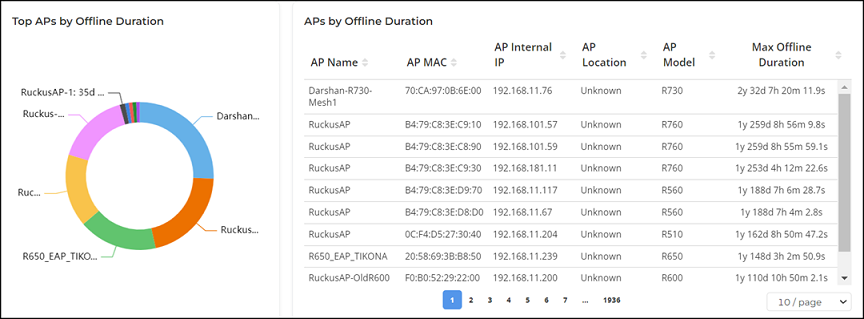
Top APs by Offline Duration Tile
The Top APs by Offline Duration tile contains a donut chart and a table. The donut chart displays the top 10 APs in the network that have been disconnected for the longest duration for the selected time period in the Date and Time filter. Pausing the pointer over the chart displays an information box with the maximum offline duration details of the selected AP. All the offline APs are displayed in a table in the APs by Offline Duration pane. The table is displayed with the AP name, MAC, internal IP, location, model, and maximum offline duration. In the table, you can select the number of APs displayed in the tile from the drop down at the bottom of the table.
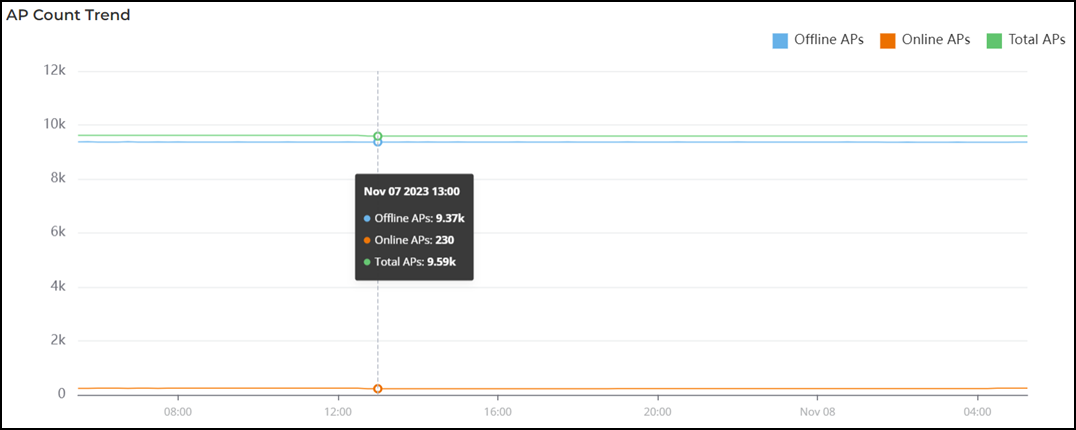
AP Count Trend Tile
The AP Count Trend tile contains a graph that displays the APs online, offline, and total count trend for the selected time period in the Date and Time filter. Pausing the pointer over the graph displays an information box with the AP details at that time and date.
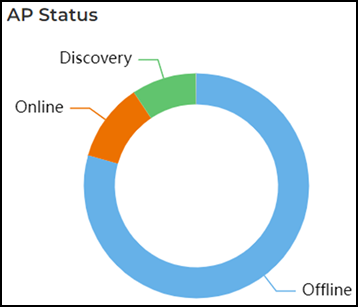
AP Status Tile
The AP Status tile contains a donut chart that displays the top APs by connection and uptime status, such as online, offline, provisioned, discovery, and other classifications for the selected time period in the Date and Time filter. Pausing the pointer over the chart displays an information box with the details of the selected AP.
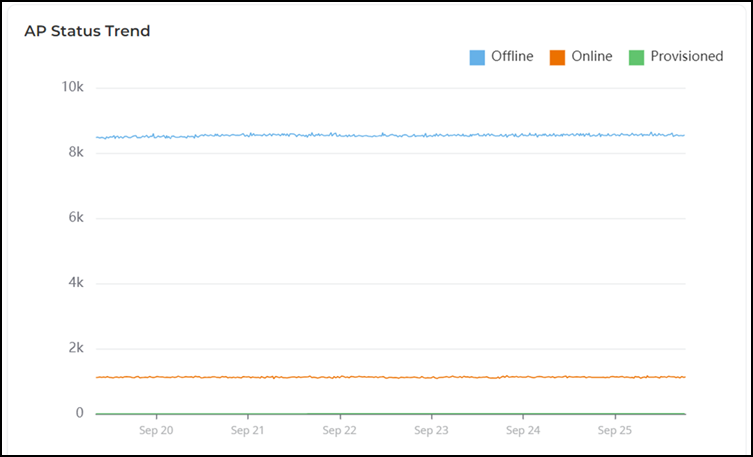
AP Status Trend Tile
The AP Status Trend tile contains a graph that displays the count of APs that are online, offline, and provisioned for the selected time period in the Date and Time filter. Pausing the pointer over the graph displays an information box with the online, offline, and provisioned at that time and date. You can hide any of this information displayed in the graph by clicking the Online, Offline, or Provisioned icon at the top of the graph. The information icon that is hidden is displayed in gray.
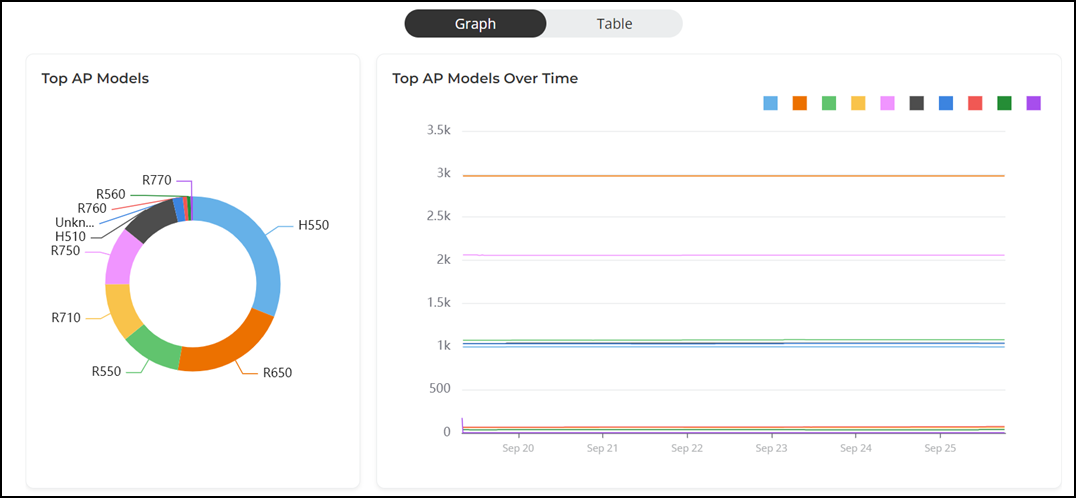
Top AP Models Tile
The Top AP Models tile contains two panes Top AP Models and Top AP Models Over Time.
The Top AP Models pane displays a donut chart. The donut chart display the top 10 AP model type that is most often used in your network for the selected time period in the Date and Time filter. Pausing the pointer over the chart displays an information box with the details of the selected AP model.
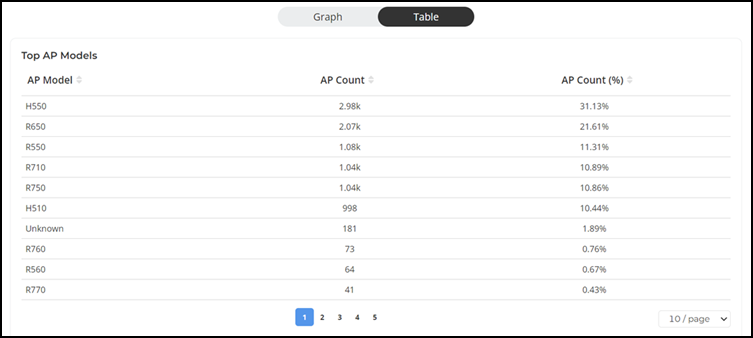
To view all the AP models, click Table icon. The table is displayed with the AP model, count, and count percentage information for the selected time period in the Date and Time filter. In the table, you can select the number of APs displayed in the tile from the drop down at the bottom of the table.
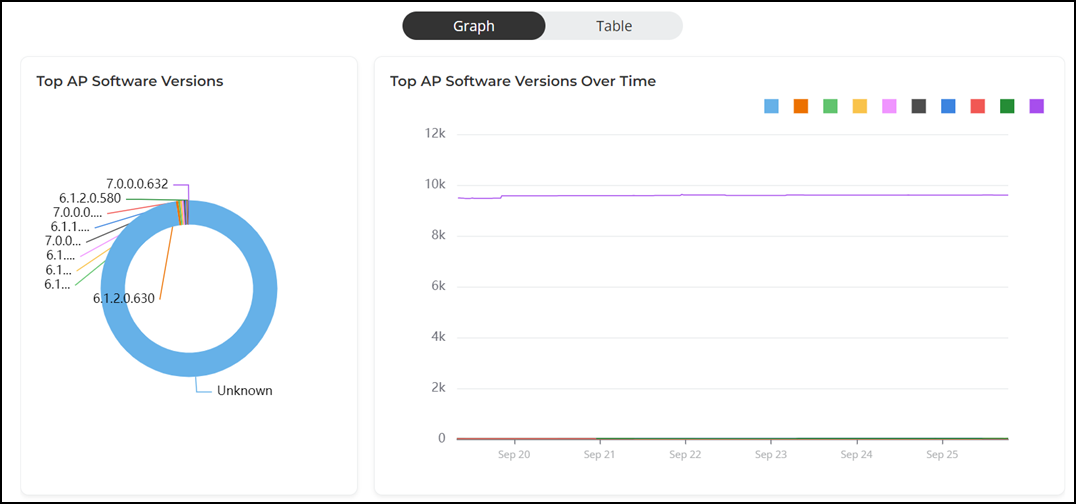
Top AP Software Versions Tile
The Top AP Models tile contains two panes Top AP Software Versions and Top AP Software Versions Over Time.
The Top AP Software Versions pane displays a donut chart. The donut chart display the top 10 most-used AP software versions in your network, along with the count of APs using each software versions for the selected time period in the Date and Time filter. Pausing the pointer over the chart displays an information box with the details of the selected software versions.
The Top AP Software Versions Over Time pane displays a graph. The graph display the top 10 AP most-used AP software versions in your network, along with the count of APs using each software versions for the selected time period in the Date and Time filter. Pausing the pointer over the graph displays an information box with the details of the selected AP software versions along with the count of APs using each software versions at that time and date. Click any of the colored squares to hide the selected software versions in the graph. The information icon that is hidden is displayed in gray.
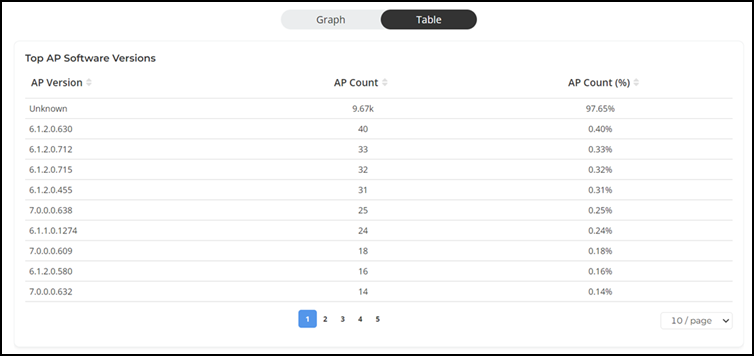
To view all the AP software versions, click Table icon. The table is displayed with the AP version, count, and count percentage information for the selected time period in the Date and Time filter. In the table, you can select the number of AP software versions displayed in the tile from the drop down at the bottom of the table.
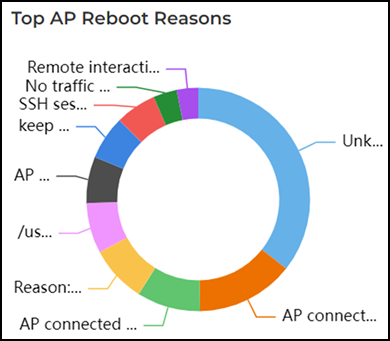
Top AP Reboot Reasons Tile
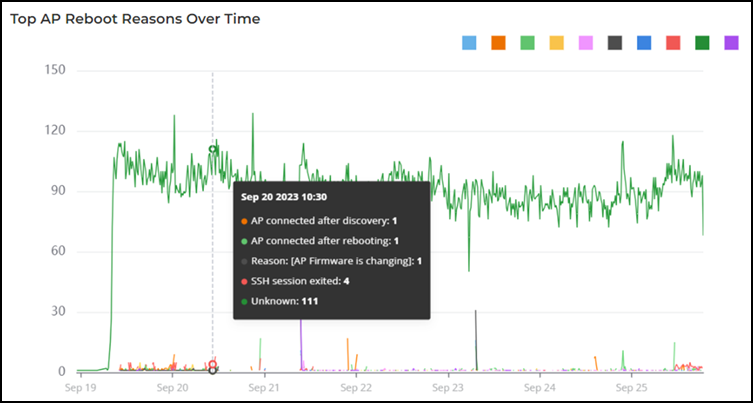
Top AP Reboot Reasons Over Time Tile
The Top AP Reboot Reasons Over Time tile contains a graph that displays the top 10 most common reasons why APs in your network have rebooted for the selected time period in the Date and Time filter. Pausing the pointer over the graph displays an information box with the reboot reasons along with the count of APs affected by that reboot at that time and date. Click any of the colored squares to hide the reboot reasons in the graph. The information icon that is hidden is displayed in gray.
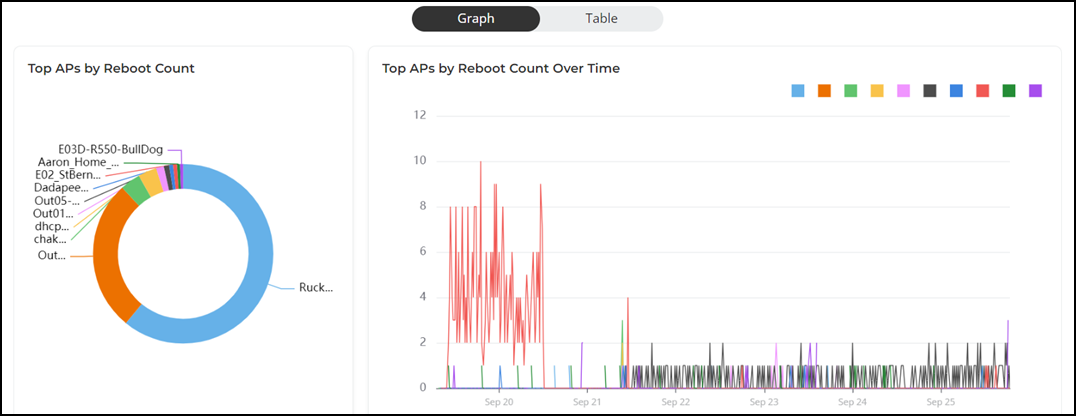
Top APs by Reboot Count Tile
The Top APs by Reboot Count tile contains two panes Top APs by Reboot Count and Top APs by Reboot Count Over Time.
The Top APs by Reboot Count pane displays a donut chart. The donut chart display the top 10 APs in your network that have rebooted most frequently for the selected time period in the Date and Time filter. Pausing the pointer over the chart displays an information box with the details of the selected AP.
The Top APs by Reboot Count Over Time pane displays a graph. The graph display the top 10 APs in your network that have rebooted most frequently for the selected time period in the Date and Time filter. Pausing the pointer over the graph displays an information box with the details of the selected AP at that time and date. Click any of the colored squares to hide the selected software versions in the graph. The information icon that is hidden is displayed in gray.
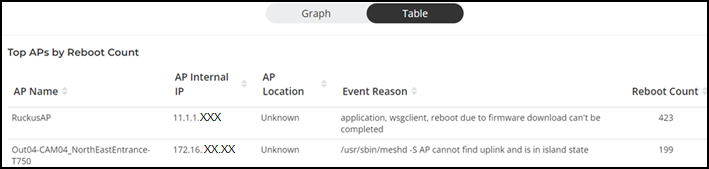
To view all the APs that have rebooted most frequently, click Table icon. The table is displayed with the AP name, internal IP, location, event reason, and reboot count information for the selected time period in the Date and Time filter. In the table, you can select the number of APs displayed in the tile from the drop down at the bottom of the table.
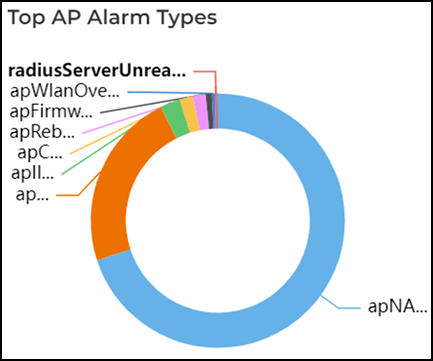
Top AP Alarm Types Tile
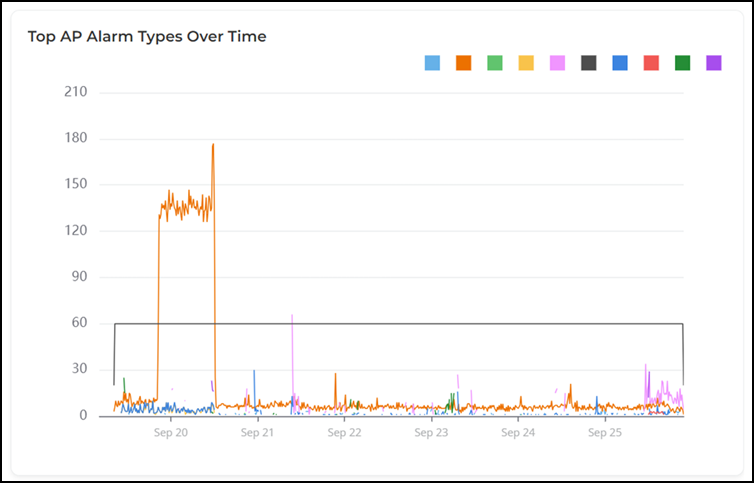
Top AP Alarm Types Over Time Tile
The Top AP Alarm Types Over Time tile contains a graph that displays the top 10 alarm types that have most frequently occurred to APs in your network for the selected time period in the Date and Time filter. Pausing the pointer over the graph displays an information box with the alarm details at that time and date. Click any of the colored squares to hide the reboot reasons in the graph. The information icon that is hidden is displayed in gray.
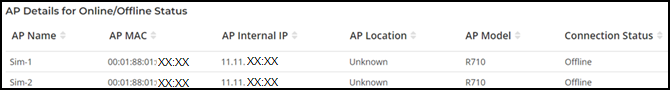
AP Details for Online/Offline Status Table
The AP Details for Online/Offline Status table displays its status details based on AP name, MAC, Internal IP address, location, model name, and connection status for the selected time period in the Date and Time filter. In the table, you can select the number of APs displayed in the tile from the drop down at the bottom of the table.